

The choices that determine whether your MMM (Marketing Mix Model) actually works
The hardest problem in MMM isn’t the model. It’s the decisions you make before running it. Raunak (Senior Manager, GTM Analytics @ Intercom, ex-Stripe, Atlassian) takes us through them.

First things first: This article was co-written with Raunak Kumar. He has built and operated MMMs in-house across product-led and sales-led growth environments at leading tech companies like Intercom, Stripe and Atlassian working at the intersection of marketing measurement, attribution, and GTM decision-making.
Event announcement: This Thursday, we’re organising a one-hour free Attribution Masterclass on triangulated attribution. There are still spots available and you can register here.
If you’re reading this, you probably don’t need convincing that Marketing Mix Models matter. Attribution is broken, privacy regulation has made user-level tracking unreliable, and open-source tools like Meta’s Robyn and Google’s Meridian have made it possible to build a working MMM in weeks.
But having a model isn’t the same as having the right model. And having the right model isn’t the same as making good decisions with it.
Raunak has built MMMs in-house in B2B, across both product-led and sales-led environments, and the most important thing he’s learned is this: the decisions you make *before* the model runs matter far more than the modeling technique itself. Most of what goes wrong in MMM happens at the design stage: in choices that seem small but quietly reshape every result.
We’ll walk through the key decisions, what happens when you get them wrong, and the mistakes that taught us the most.
So… should you even build an MMM?
No, not every business should. MMM is powerful, but it has specific data requirements that many B2B companies don’t meet. Building a model without meeting them produces results that look credible but aren’t.
Before committing to an MMM, run through these three prerequisites:
Prerequisite 1: Do you have enough data history?
MMMs need to observe how outcomes change as marketing inputs change. That requires at minimum 1–2 years of historical data: enough to capture full seasonality cycles, budget shifts, and campaign launches. Without this, the model can’t distinguish seasonal effects from marketing effects.
In B2B, this bar is even higher. Enterprise sales cycles can stretch 6–12 months, meaning a single quarter of data may contain deals that were influenced by marketing activity from the prior year. Short data windows in B2B don’t just reduce power. They create systematic bias.
The check: Can you pull at least 18 months of consistent, weekly-grain spend data alongside weekly outcome data (leads, pipeline, or revenue)? If not, you’re not ready.
Prerequisite 2: Is there enough variation in your marketing spend?
This is the prerequisite most people miss: and it’s the most important one.
MMM works by observing what happens when spend levels change. If your budget is relatively flat across channels and quarters, the model has no variation to learn from. It will still produce coefficients and saturation curves. They just won’t mean anything.
Most teams think of MMM “readiness” in terms of total spend. “Do we spend at least $1M a year?” But budget alone doesn’t make you an MMM candidate.
Consider a company like Apple: massive marketing budget, enormous brand awareness, but so little week-to-week variation in their primary market that an MMM would struggle to isolate the impact of individual campaigns. Budget alone doesn’t make you an MMM candidate. Variation does.
Consider a company like Apple: massive marketing budget, enormous brand awareness, but so little week-to-week variation in their primary market that an MMM would struggle to isolate the impact of individual campaigns. Budget alone doesn’t make you an MMM candidate. Variation does.
Think of it like a science experiment: if you never change the dosage, you can’t measure the effect. The same applies to marketing spend. The model needs to see periods where you spent significantly more, significantly less, or shifted allocation between channels.
The check: Look at your channel-level weekly spend over the past year. Are there meaningful fluctuations, or is it essentially flat? If spend is stable (±10%) most weeks, incrementality tests (geo holdouts, pause tests) may be a better starting point than a full MMM.
Prerequisite 3: Does a meaningful share of your conversions come from channels you directly control?
MMM measures the incremental impact of marketing investments. If the vast majority of your conversions come from organic search, direct traffic, word-of-mouth, or product-led virality—and paid media is a small fraction of total demand—the model will have difficulty isolating paid channel effects from background noise.
This doesn’t mean you need paid media to be dominant. But if paid channels drive less than ~20-30% of your total top-of-funnel activity, the signal-to-noise ratio may be too low for the model to produce reliable channel-level estimates.
The check: What share of your pipeline or revenue is influenced by channels where you control the spend lever? If organic and direct dominate and paid is marginal, consider starting with incrementality testing (geo holdouts, pause tests) rather than a full MMM.
The bottom line
If you can’t check all three boxes (sufficient history, meaningful spend variation, and a material share of controllable channels), then building an MMM will give you numbers, but they won’t be numbers you should trust. Start with the data foundation first.
If you can check all three: read on. The model is the easy part. The decisions are what matter.
The six decisions that shape everything for MMMs
Decision 1: Who are you building this for?
This is the single most consequential choice in any MMM, and it’s the one most teams make too quickly.
In B2B, especially when you’re running both self-serve and sales-assisted motions, there are at least three competing definitions of “success”:
Growth teams care about signups, trials, and activation
Sales teams care about pipeline and bookings
Finance cares about revenue, CAC payback, and long-term ROI
These groups will interpret the same model output in completely different ways. A saturation curve that tells Growth “we can still scale this channel” tells Finance “we’re overspending for diminishing returns.” An MMM doesn’t resolve that tension: it inherits whichever definition of success you hardwire into the dependent variable.
An MMM forces you to pick one. And that single choice quietly dictates how ROI, saturation, and budget decisions will be interpreted downstream.
Our mistake: Raunak’s team built their first MMM for the Growth team without realizing that Finance would use the same outputs to justify budget cuts. The model optimized for what Growth wanted (volume), but Finance drew conclusions about efficiency that the model was never designed to support. The numbers weren’t wrong: they were answering a different stakeholder’s question.
It’s like a doctor summarizing your health with a single number. Your weight, blood pressure, cholesterol, and sleep quality all matter, but collapsing them into one score hides which systems need attention. An MMM that treats all conversions as equal has the same problem.
Before you choose a metric, choose your audience. The technical tradeoffs of each metric come next (Decision 2), but if you skip the political alignment, even the “right” metric will produce outputs that get misused.

Decision 2: Which outcome variable, and what are the tradeoffs?
Once you’ve aligned on who the model serves (Decision 1), you still have to pick the metric. Each option carries real tradeoffs that aren’t obvious until the model runs:
Signups or leads. High signal density and fast feedback. Product-led companies typically achieve conversion rates 1.5–2x higher than sales-led ones, and their CAC can be under $500 compared to $5,000+ for enterprise deals. Great for PLG optimization. But this outcome treats all leads as equal and makes saturation curves look artificially forgiving. Channels generating cheap, low-LTV volume appear endlessly scalable.
Pipeline created. Closer to revenue. Aligns with sales planning and forecasting. But the signal is sparse and lagged. B2B SaaS companies average nearly 270 touchpoints and close to 3,000 impressions per closed deal, with high-value deals approaching 400+ touchpoints. That’s an inherently noisy attribution surface. And pipeline breaks down entirely for self-serve motions where value accrues before any sales touchpoint.
Revenue or bookings. The cleanest ROI narratives for executives — 84% of CMOs now prioritize ROI when justifying budget allocation. But revenue is highly volatile, biased toward sales-led segments, and makes it nearly impossible for MMMs to learn stable response curves in a growing business.
The key insight: each choice reshapes what “saturated” and “efficient” mean in materially different ways. You’re not just picking a metric. You’re picking which version of reality your organization will operate on.
Our mistake: Raunak’s first MMM used signups as the outcome variable: high signal density, fast feedback, obvious choice. But it told us certain paid channels were nearly infinitely scalable. They were scalable for volume, but most of that volume was low-LTV self-serve signups. We were optimizing for quantity, not value. The model wasn’t wrong. We were asking it the wrong question.
Our recommendation: Run the model on multiple outcomes if you can.
The differences between them are revealing. When signups say “scale this channel” and pipeline says “it’s saturated,” you’ve learned something important about the quality of demand that channel generates.
Decision 3: Do you segment by motion, or model everything together?
This decision is where most B2B MMMs silently break.
MMM saturation curves assume that incremental outcomes are homogeneous. In B2B, they never are. Self-serve users have smaller lifetime values and faster conversion cycles. Sales-led customers have larger lifetime values and longer, multi-stage journeys. The industry benchmark is a 3:1 LTV-to-CAC ratio, but that ratio looks completely different depending on which motion generated the customer.
When these motions are modeled together against a single outcome, saturation curves distort reality. Upper-funnel channels look “saturated too early” when modeling against pipeline (because self-serve conversions are measured against a sales-led yardstick). Conversely, they look endlessly scalable when modeling against leads.
Our mistake: We spent weeks debugging what we thought was a modeling issue: certain channels appeared to saturate far earlier than our spend levels suggested they should. The model was fine. The problem was that we were mixing self-serve and sales-led demand in a single response curve. Once we segmented them, the saturation estimates made sense. The fix wasn’t better math, it was better outcome design.
The fix: Separate response curves for self-serve and sales-assisted motions. This is harder than it sounds (it requires clean demand-source tagging upstream), but it’s where the real leverage is.
Decision 4: What time horizon are you measuring over?
Industry research on adstock half-lives is consistent: FMCG brands typically see advertising half-lives of around 2.5 weeks. Performance channels like paid search decay within days. Brand channels show longer persistence, but academic studies generally place their half-lives in the 7–12 week range.
In our own models, adstock analysis showed brand channels delivering roughly half their marginal impact within the first couple of weeks. Performance channels acted even faster. On paper, this suggested brand effects were short-lived.
But when we ran correlation analysis between sustained brand investment and business outcomes, the picture was strikingly different: outcomes peaked around six to eight weeks after sustained investment began.
Both findings were correct. They were measuring different things.
Our mistake: Early on, we used adstock decay windows as decision windows. We saw that brand impact decayed within weeks and concluded we could dial brand spend up and down tactically. We cut a brand campaign after three weeks because the model showed marginal returns declining. What we didn’t realize was that sustained spend was still compounding at the system level — individual exposures decay quickly, but campaigns take time to reach full momentum. We cut right as cumulative impact was forming.
What to check before choosing your time horizon: Look at two metrics. First, your channel-level adstock decay curves: how quickly does a single exposure lose influence? Second, your campaign-level outcome lag: how long after sustained investment do business results actually move? If those two numbers are far apart (and in B2B, they usually are), your time horizon needs to account for the longer one, not the shorter one.
This mistake is more common than people realize. Paid media now captures 30.6% of total marketing investment, and marketers facing budget pressure are disproportionately reallocating from brand to performance. Some researchers have called this the “doom loop”: slowing growth compels optimization using short-term attribution metrics, which starves brand investment, which erodes organic demand, which slows growth further.
The self-reinforcing cycle. Budget pressure triggers a shift to performance, which starves brand, which erodes organic demand, which slows growth. 33% of marketers plan to cut traditional media spend in 2026.
Decision 5: How do You communicate uncertainty?
In one of our MMM implementations, brand channels showed clear incremental impact but low current-period ROI: consistent with a mid-maturation phase. Based on observed elasticities and planned spend levels, we projected a path toward meaningfully improved ROI over the following two quarters.
That number started getting used in planning decks. Then in board slides. Then as a target.
Our mistake: We presented a point estimate when we should have presented a range. The projected ROI was an expected trajectory, conditional on sustained investment, stable market conditions, and model retraining with new data. MMM outputs are probabilistic. Elasticities describe how the system has behaved, not how it must behave. When spend moves outside historical ranges, uncertainty increases substantially.
The lesson: mature MMM practice means making uncertainty explicit, not hiding it behind a single number. Present ranges. Declare confidence levels. Treat model outputs as inputs to judgment, not substitutes for it. Companies that do this well report 15–30% higher marketing ROI and reduce wasted ad spend by up to 27%. Not because their models are better, but because their decision-making is more honest.
Decision 6: How do you handle geography?
When building models across multiple regions, we found that the relative contribution of marketing channels to growth varied dramatically. In some cases, certain regions were roughly twice as reliant on paid channels for top-of-funnel growth compared to more mature markets where organic channels carried more weight.
Marketing budgets hit a historic milestone in 2025 at 9.4% of company revenues (up from 7.7% in 2024, per the Duke/Deloitte CMO Survey), but allocation varies wildly by market maturity.
The tradeoff we didn’t see coming: A global ROI threshold that allocates spend to whichever market drives the best return will maximize total efficiency, but it creates deeply uneven growth across regions. A mature market with strong organic demand will always look more “efficient” than a developing market that needs paid investment to build awareness. Whether that’s acceptable is a strategic question, not a modeling question. The model can’t answer it for you.
How to act on this: If balanced growth across regions matters—because you’re entering a new market, or because your board expects geographic diversification—set allocation floors for developing markets, even if global ROI dips slightly. If total efficiency is the priority and you’re comfortable with uneven growth, let the optimizer allocate freely. The model gives you the map. Strategy decides which roads to take.
Putting it all together with a maturity ladder
Having gone through these decisions (and made most of these mistakes), we’ve come to think about MMM maturity as a progression. It’s not about modeling sophistication. It’s about decision quality.
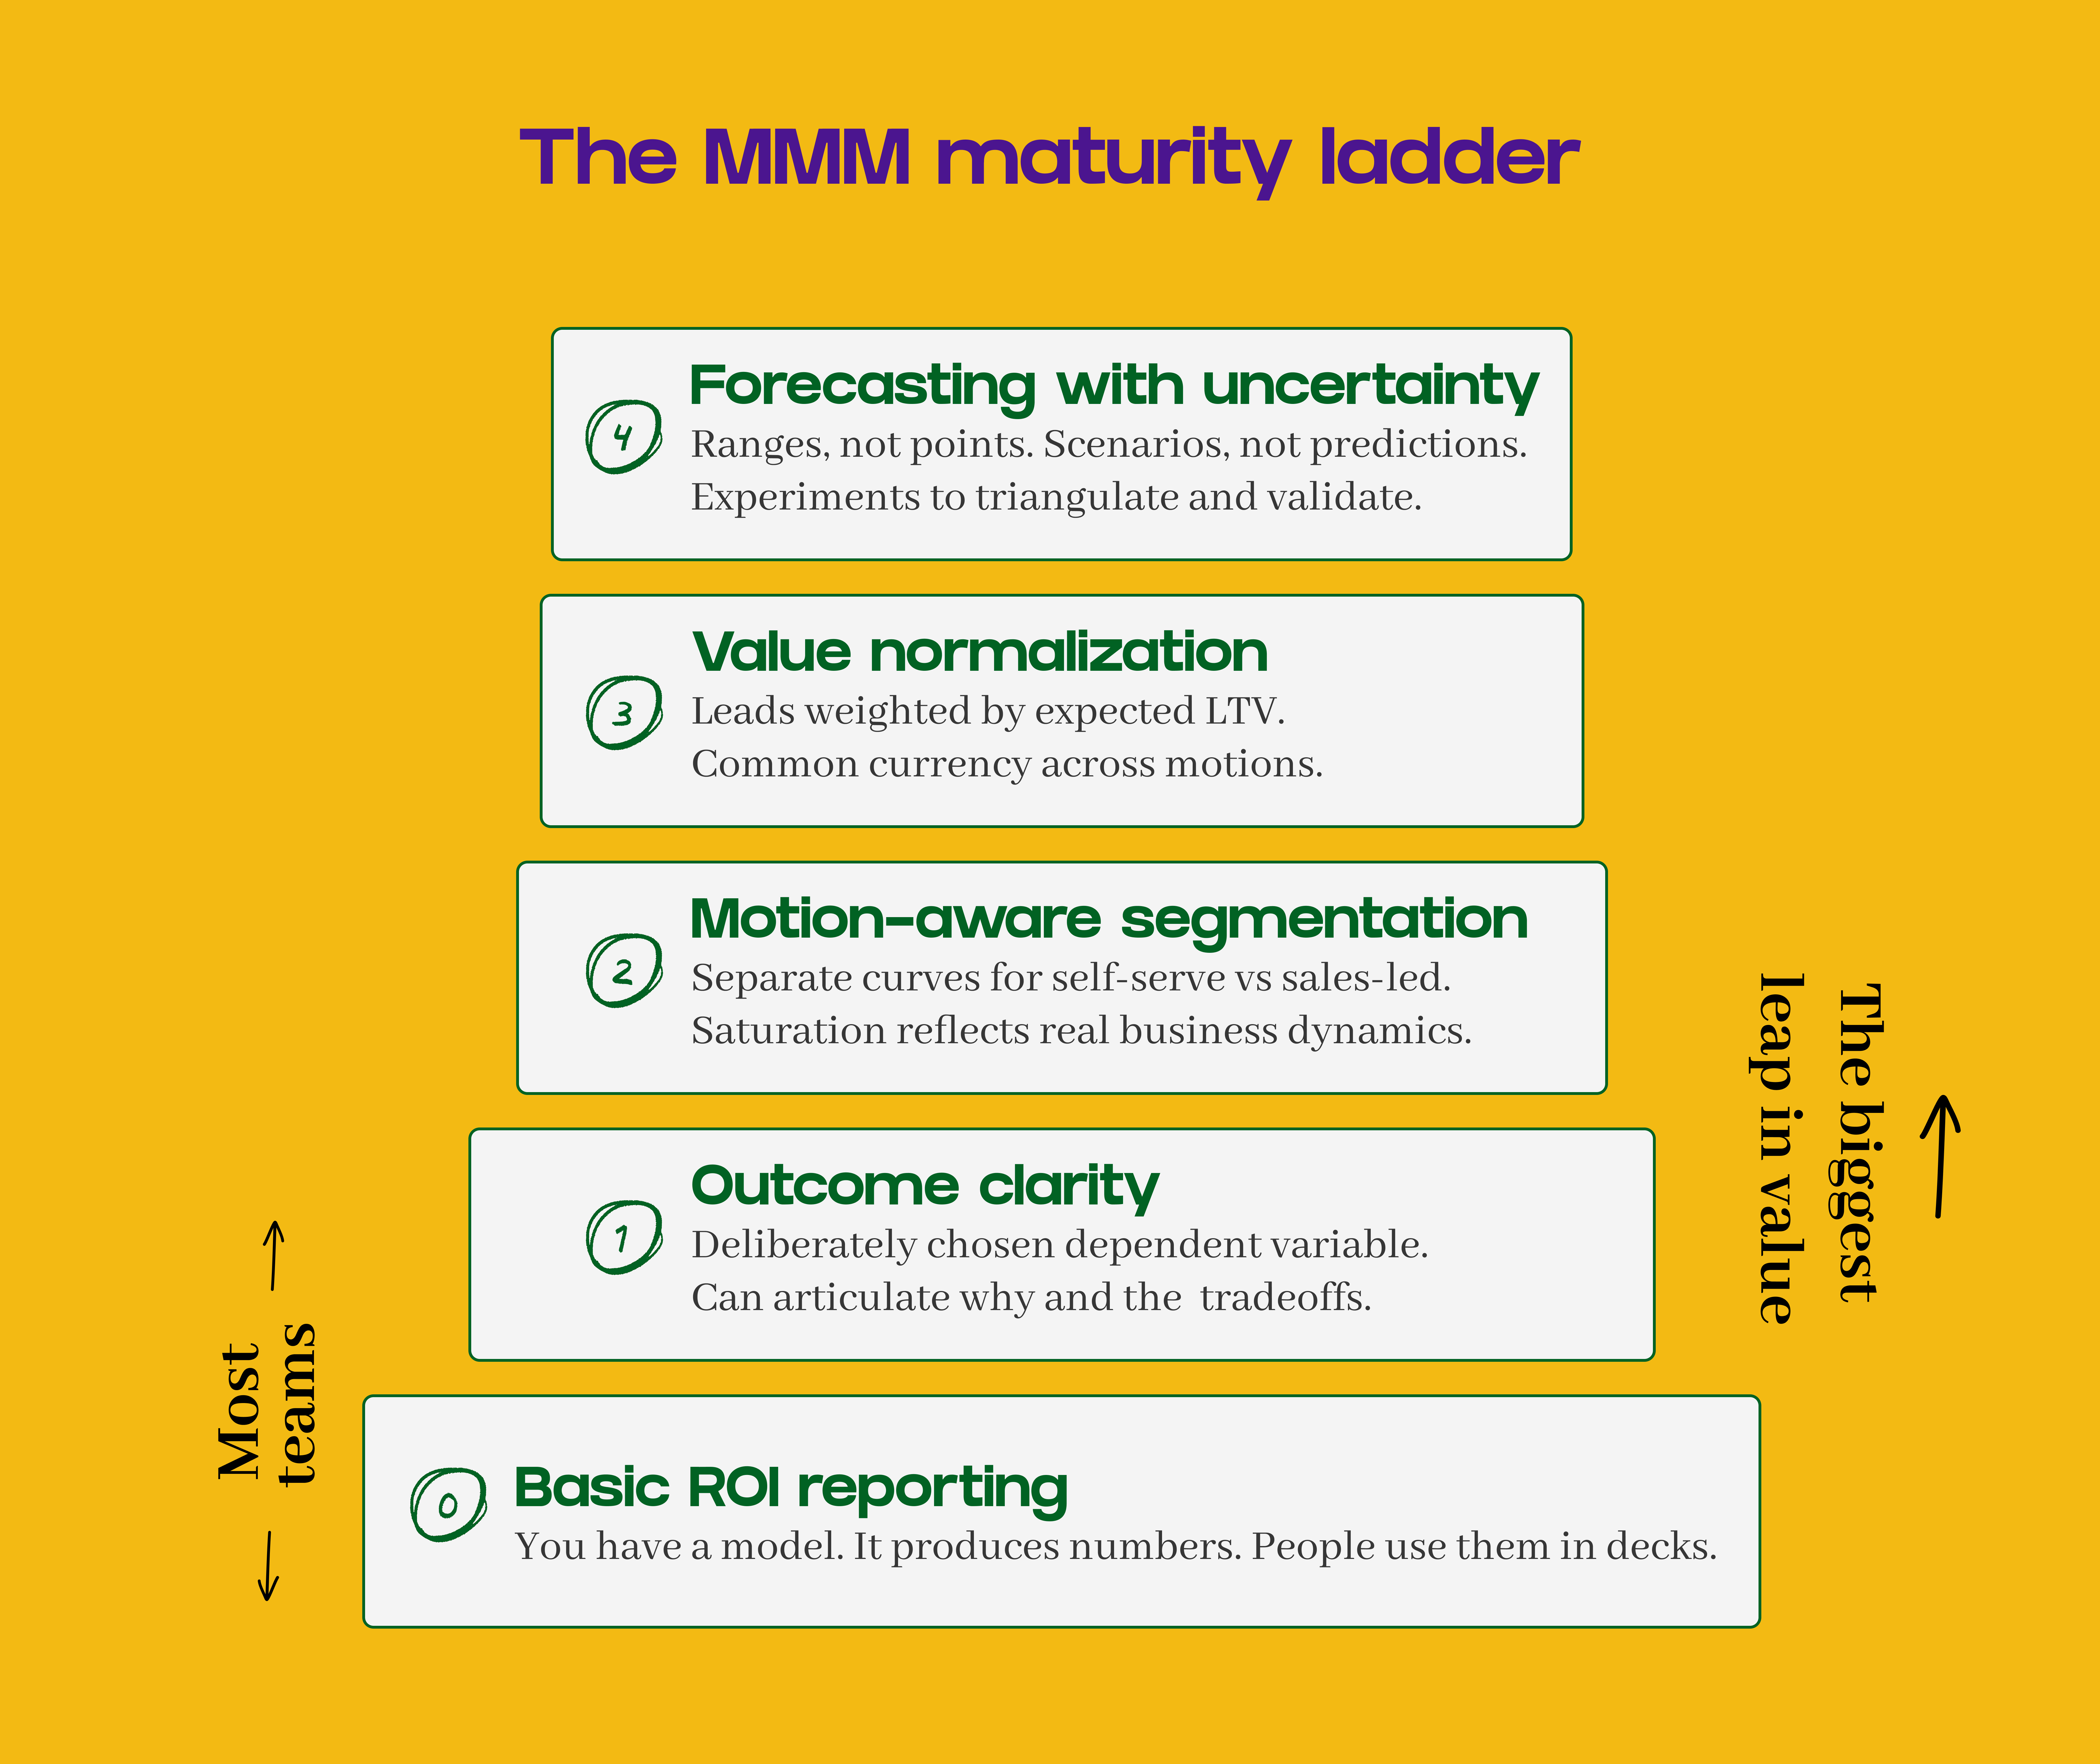
Most teams are somewhere between Level 0 and Level 1. The data supports this: 56% of marketers still struggle to track customer journeys accurately, and the average B2B buyer engages in over 60 touchpoints across a 10-month sales cycle. Customer acquisition costs have risen 60% in five years.
The jump to Level 2 is where the real leverage is. And it doesn’t require a better model: it requires asking better questions.
When to Rebuild vs. Refresh
A common mistake is treating your MMM as a one-time project. The model you built six months ago was trained on a different spend mix, different market conditions, and possibly a different product lineup.
At minimum, refresh your model quarterly. Retrain on updated data without changing the structure. Rebuild when something fundamental shifts: a new sales motion launches, you enter a new region, a major channel gets added or dropped, or your outcome variable changes.
The signal that your model needs attention isn’t a dashboard. It’s when the model’s recommendations start contradicting what your team observes in the field. That gap between model output and operator intuition is where the most important conversations happen.
Raunak’s rules for B2B companies starting on MMM
Check the prerequisites first. Do you have 1–2 years of data, meaningful spend variation, and enough paid media volume? If not, start with incrementality testing — geo holdouts or pause tests — before investing in a full model.
Pick your outcome variable deliberately. Don’t default to whatever’s easiest to measure. Understand the tradeoffs. Run the model on multiple outcomes if you can — the differences are revealing.
Segment before you model. If you’re running both self-serve and sales-led motions, don’t collapse them. The economics are different. The response curves are different. The insights will be different.
Don’t confuse adstock decay with decision horizons. Just because a brand dollar’s marginal effect fades in weeks doesn’t mean you can turn brand spend on and off like a faucet. Sustained investment compounds. Give it time.
Present ranges, not points. The moment your MMM output lands in a planning deck as a single number, it stops being a probabilistic estimate and becomes a promise. That’s how trust erodes.
Run experiments alongside the model. MMM tells you what the data suggests. Incrementality tests tell you what actually happened. Use both. Neither is sufficient alone.
Accept that some questions aren’t modeling questions. “Should we prioritize efficiency or regional growth?” is a strategy question. The model can inform it, but it can’t answer it.
If you’ve enjoyed reading this piece, then don’t forget to subscribe to 021 Newsletter for free below. We publish one article a month on the intersection of marketing and data.