

How to build marketing reports that calculate campaigns' ROI
We cover how Mixpanel’s different attributions models can answer burning marketing questions on campaigns’ impact that go beyond CAC

First things first, this article is sponsored by Mixpanel, an analytics platform that enables product and marketing teams to measure ROI. I’m hosting a webinar diving into Mixpanel marketing reporting in more detail. 👉 Register here.
Measuring campaigns’ ROI in centralized analytics tools
CAC alone doesn’t cut it. To understand which marketing campaigns should be scaled up or down, marketing reporting needs to go beyond leads and move into revenue. In this article, we cover how Mixpanel’s attribution models help answer critical marketing questions—like which campaigns bring the most valuable users and highest ROI.
How we report marketing results impacts our decision-making
The challenge with relying solely on marketing analytics
Most marketers use marketing analytics tools (like Google Analytics) to report and analyze marketing campaigns. But with marketing analytics tools alone, we’re still left wondering about some of our biggest questions about which marketing strategies…
...are acquiring the most valuable users?
…have the highest ROI?
…should we allocate more of the budget to?
That’s because user revenue data doesn’t live in marketing analytics. To report on metrics like LTV per campaign, marketing analytics data sets must be joined with wherever revenue data lives (CRM, data warehouse, etc.) and accessed via BI tools.
It’s easier to report on proxies such as CAC, which tell us how much we’re paying for a lead, a sign-up, or a new subscription. But, as we know, not all users have the same business value. Some belong to bigger companies and sign up for bigger plans, some retain for much longer, and some invite many new paying customers. When LTV varies, CAC by itself doesn’t cut it.
User-level revenue attribution versus Event-level revenue attribution
There are a few reasons why CAC reporting is the marketing standard. One of them is time: We need to report on and optimize campaigns promptly, at the very least quarterly. Since CAC is immediate, it fulfills that goal. Another reason is—you could have guessed-attribution. Our standard tools (Google Analytics, Ad platforms) attribute revenue on an event-level.
Event-level attribution: Each individual activity (e.g “user created”, “purchase”, “plan upgrade”, “subscription payment”) can be a unique event attributable to an individual campaign.
User-level attribution: Only “user created” event is attributable. All subsequent revenue generated by that user is attributed to the original campaign. For sales-led organizations, an alternative to “user created” could be “lead created.”
Below, we can see how the choice between user-level and event-level attribution impacts revenue reporting. In this scenario, all revenue events are attributable.

The goal of marketing reporting: to drive ROI
At its core, the goal of marketing reporting is simple: it’s to enable marketers to understand the business value of their campaigns. Without this, we risk:
Allocating budget to initiatives that have a low CAC but also low ROAS.
Acquiring leads that Sales doesn’t care about due to low ticket size or wrong ICP.
Acquiring product sign-ups that don’t activate or subscribe.
How to build valuable marketing reports on Mixpanel
A possible way to report on LTV and ROI per campaign is to build a report (e.g., on a BI tool like Looker) that joins marketing analytics (Google Analytics, etc) with revenue data (living in a data warehouse, CRM, etc). An event analytics tool that provides both (such as Mixpanel) is a simpler alternative.
We’ll explain how to build reports on Mixpanel that enable marketers to 1) replicate standard marketing analytics reports (new users and signups per campaign) and 2) go beyond and measure ROI and user revenue. We’ll also cover how multiple attribution models help us achieve that goal.
Identifying campaigns that drive reach (for top funnel campaigns)
This report calculates the number of sessions, unique users and new users driven by each campaign. Unique users here are calculated based on device IDs. New users are users who visited the site for the very first time.
We use a first-touch attribution model, which I recommend whenever you want to measure the results of top-of-funnel campaigns.

Important to note: All analytics tools use UTMs or referral information to identify campaigns. Therefore, you can only measure sessions that have occurred from a direct click. For top-of-funnel campaigns with few or no direct clicks (e.g., OOH, video), you will need to be more creative with different methodologies like Casual Interference, as those sessions could be attributed to “Direct” , “Organic” or another marketing activity.
Identifying campaigns that reach engaged users (for top to mid funnel campaigns)
Since this report also measures prospecting campaigns, we’re again leveraging a first-touch model. In this case, we want to go beyond understanding how many new users are reached and instead identify the quality of that traffic.
To do that, we’re reporting on two separate KPIs:
Sign-ups: number of users that created an account after being initially prospected by a campaign.
Pricing: number of users that have visited a key page after being initially prospected by a campaign. We’re using the `pricing` page here, but this could be a different page for your business.

Identifying campaigns that deliver business value (for bottom funnel campaigns)
As we’ve seen, user-level and event-level attribution tell different things, just like first-touch and last-touch attribution models. Here, we cover how to mix and match attribution models to answer different marketing ROI questions.
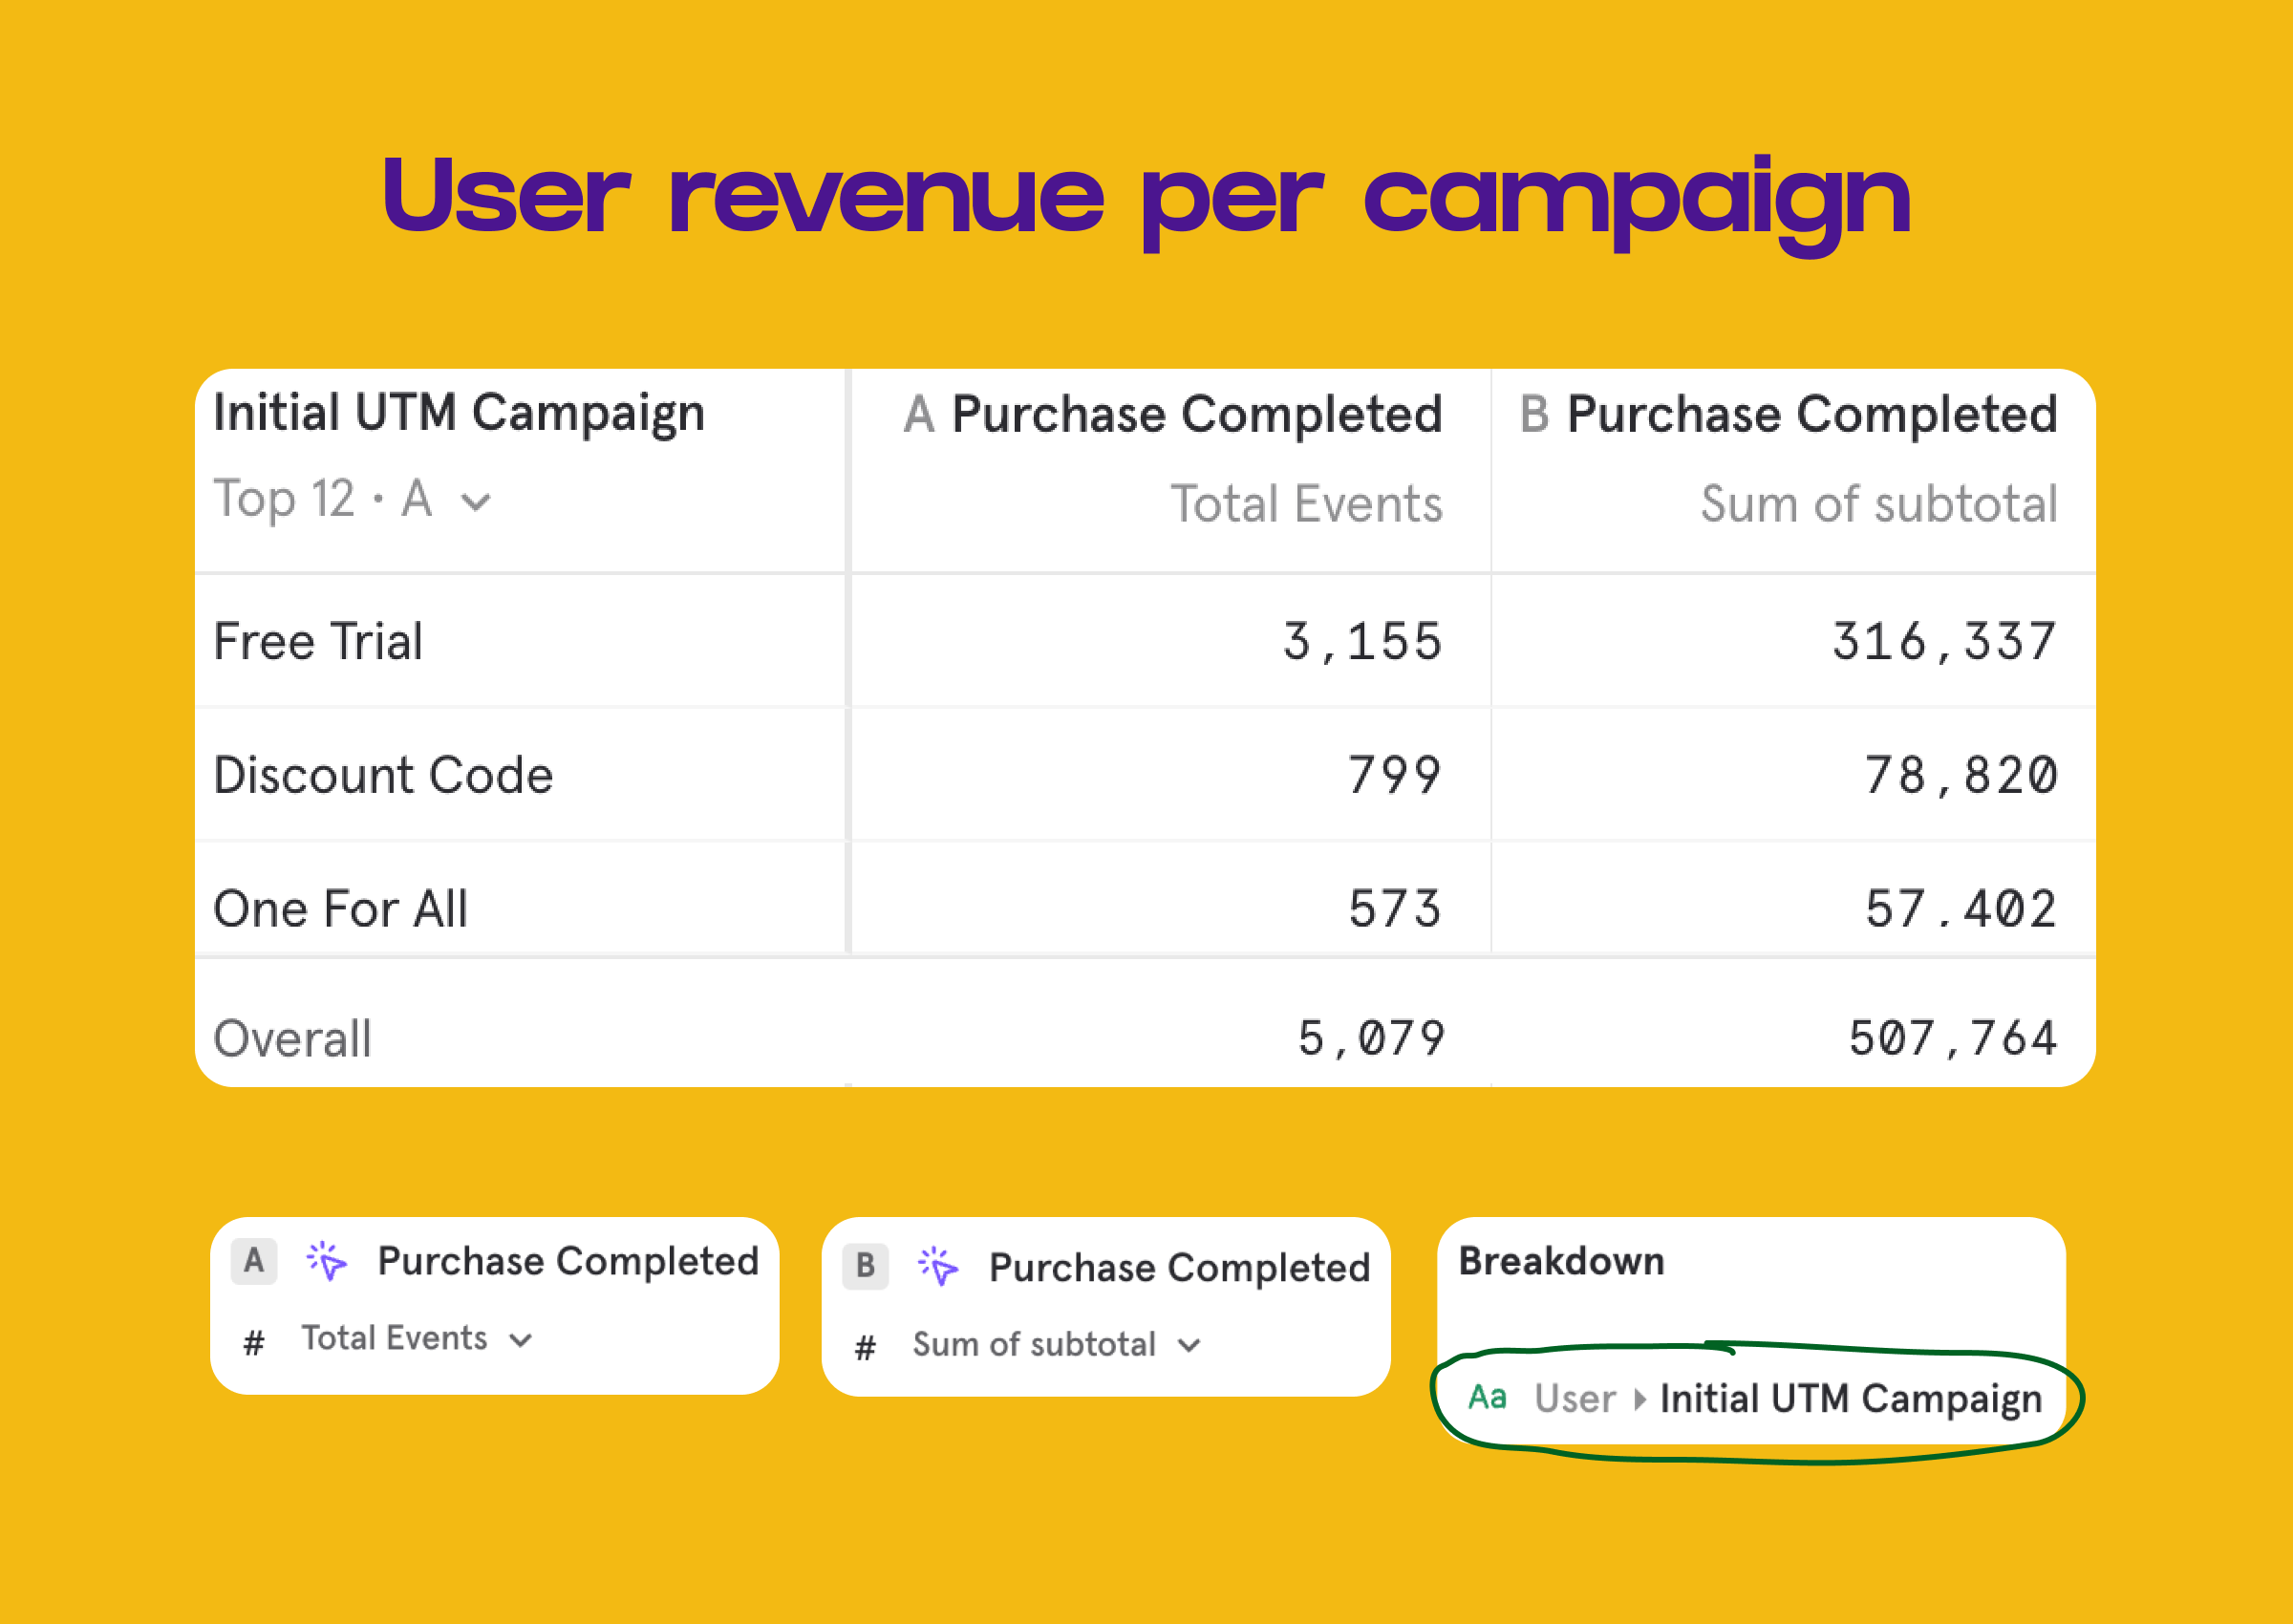
User revenue per campaign
For this report, we’re leveraging a first-touch user-level attribution model. It calculates the revenue generated by users originally prospected by certain campaigns. This is a very useful way of quantifying the value of clickable top-funnel initiatives.
On GA4, this would require BigQuery and SQL. However, on Mixpanel, we can leverage the `Initial UTM Campaign` out-of-box user variable.
Event revenue per campaign
An alternative way of measuring revenue is per event. This report calculates the number of purchases and their value attributed to each campaign. This is the type of conversion reporting that’s standard on Google Analytics.
In the example below, we’re using a last-touch model to understand which campaign reached the user just before they converted. Although we’re not filtering here, removing certain touchpoints (e.g., organic, email) from being included in this model is possible.

Unlocking better marketing reporting: what’s next?
Effective marketing reporting goes beyond CAC—it connects campaigns with real business value, like LTV and ROI. By using centralized analytics tools, like Mixpanel, and leveraging different attribution models, you can better understand which strategies drive the most valuable users and improve your marketing budget allocation.
If you’ve enjoyed reading this, don’t forget to register for my upcoming webinar with Mixpanel. In it, we’ll go through how to build these reports step by step:
