

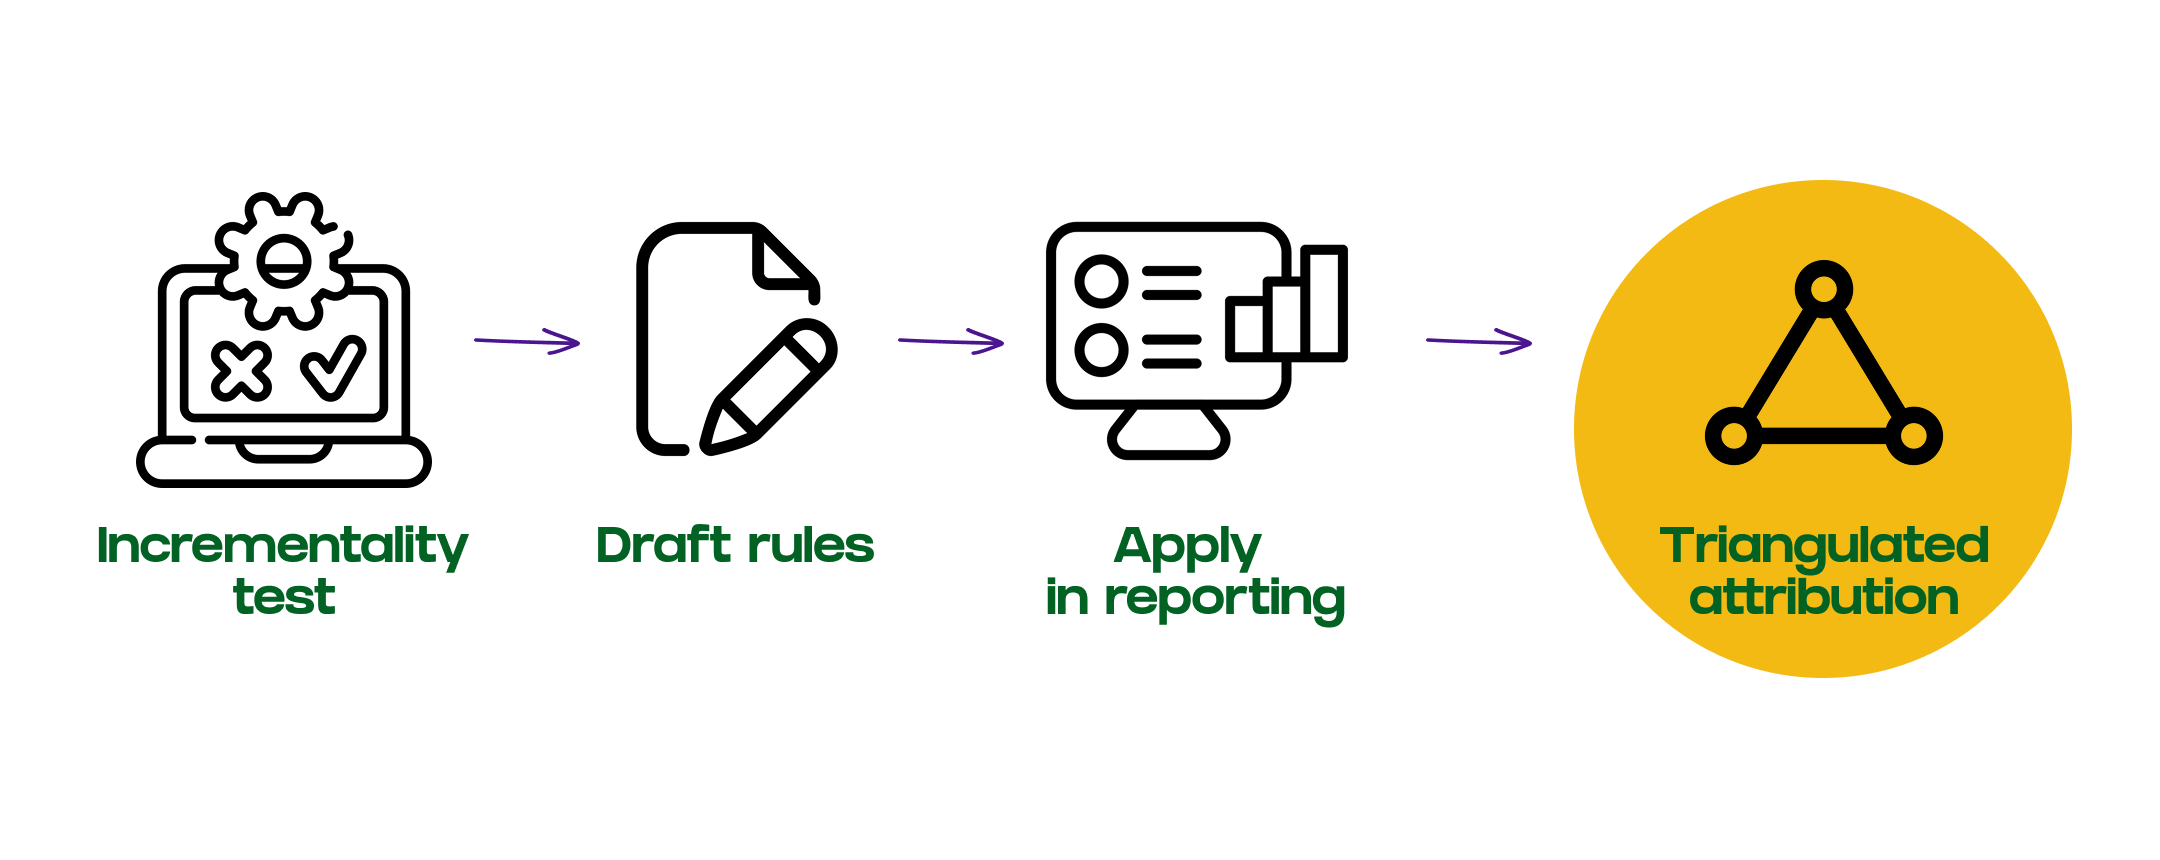
Triangulated attribution: using rules to eliminate biases in click-based MTA
Multiple evidence streams (incrementality, self-reported attribution) can help make MTA reporting "closer to reality"

Closing the gaps of multi-touch attribution
Multi-touch attribution (MTA) promises to solve the “who gets credit” problem by looking at the entire customer journey. In practice, it creates a different problem: every system builds those journeys differently, and the paths they construct systematically misrepresent which channels actually influenced the outcome.
The issue isn’t that MTA models are wrong. It’s that the touchpoint data feeding into them is incomplete and biased by design.
Search and direct traffic are over-represented because they’re easy to track. Upper-funnel channels like social and video are systematically excluded because impressions don’t generate clickable (or stitchable) trails through your analytics. Your Markov chain or Shapley model dutifully processes these incomplete paths and produces confident-looking attribution percentages that reflect tracking capability more than marketing effectiveness.
Triangulated attribution is a way to tackle this. Instead of relying on a single data source, you use multiple evidence streams (incrementality tests, self-reported attribution surveys, and platform performance data) to reach a more accurate view of channel impact. Rule-based methodology is how you operationalize it: a structured way to override MTA outputs or enrich journey data before attribution runs, using documented logic that turns experimental findings into repeatable adjustments.
This isn’t about replacing MTA with guesswork. It’s about making MTA reflect reality by correcting for the systematic biases in how touchpoints get recorded.
Where click-based attribution breaks down
Multi-touch attribution in tools like GA4, Snowplow, or custom MTA models only works if the touchpoints you’re attributing across actually represent the journey. But click-based paths have systematic gaps that make them fundamentally unreliable for measuring upper-funnel influence.
The impression problem
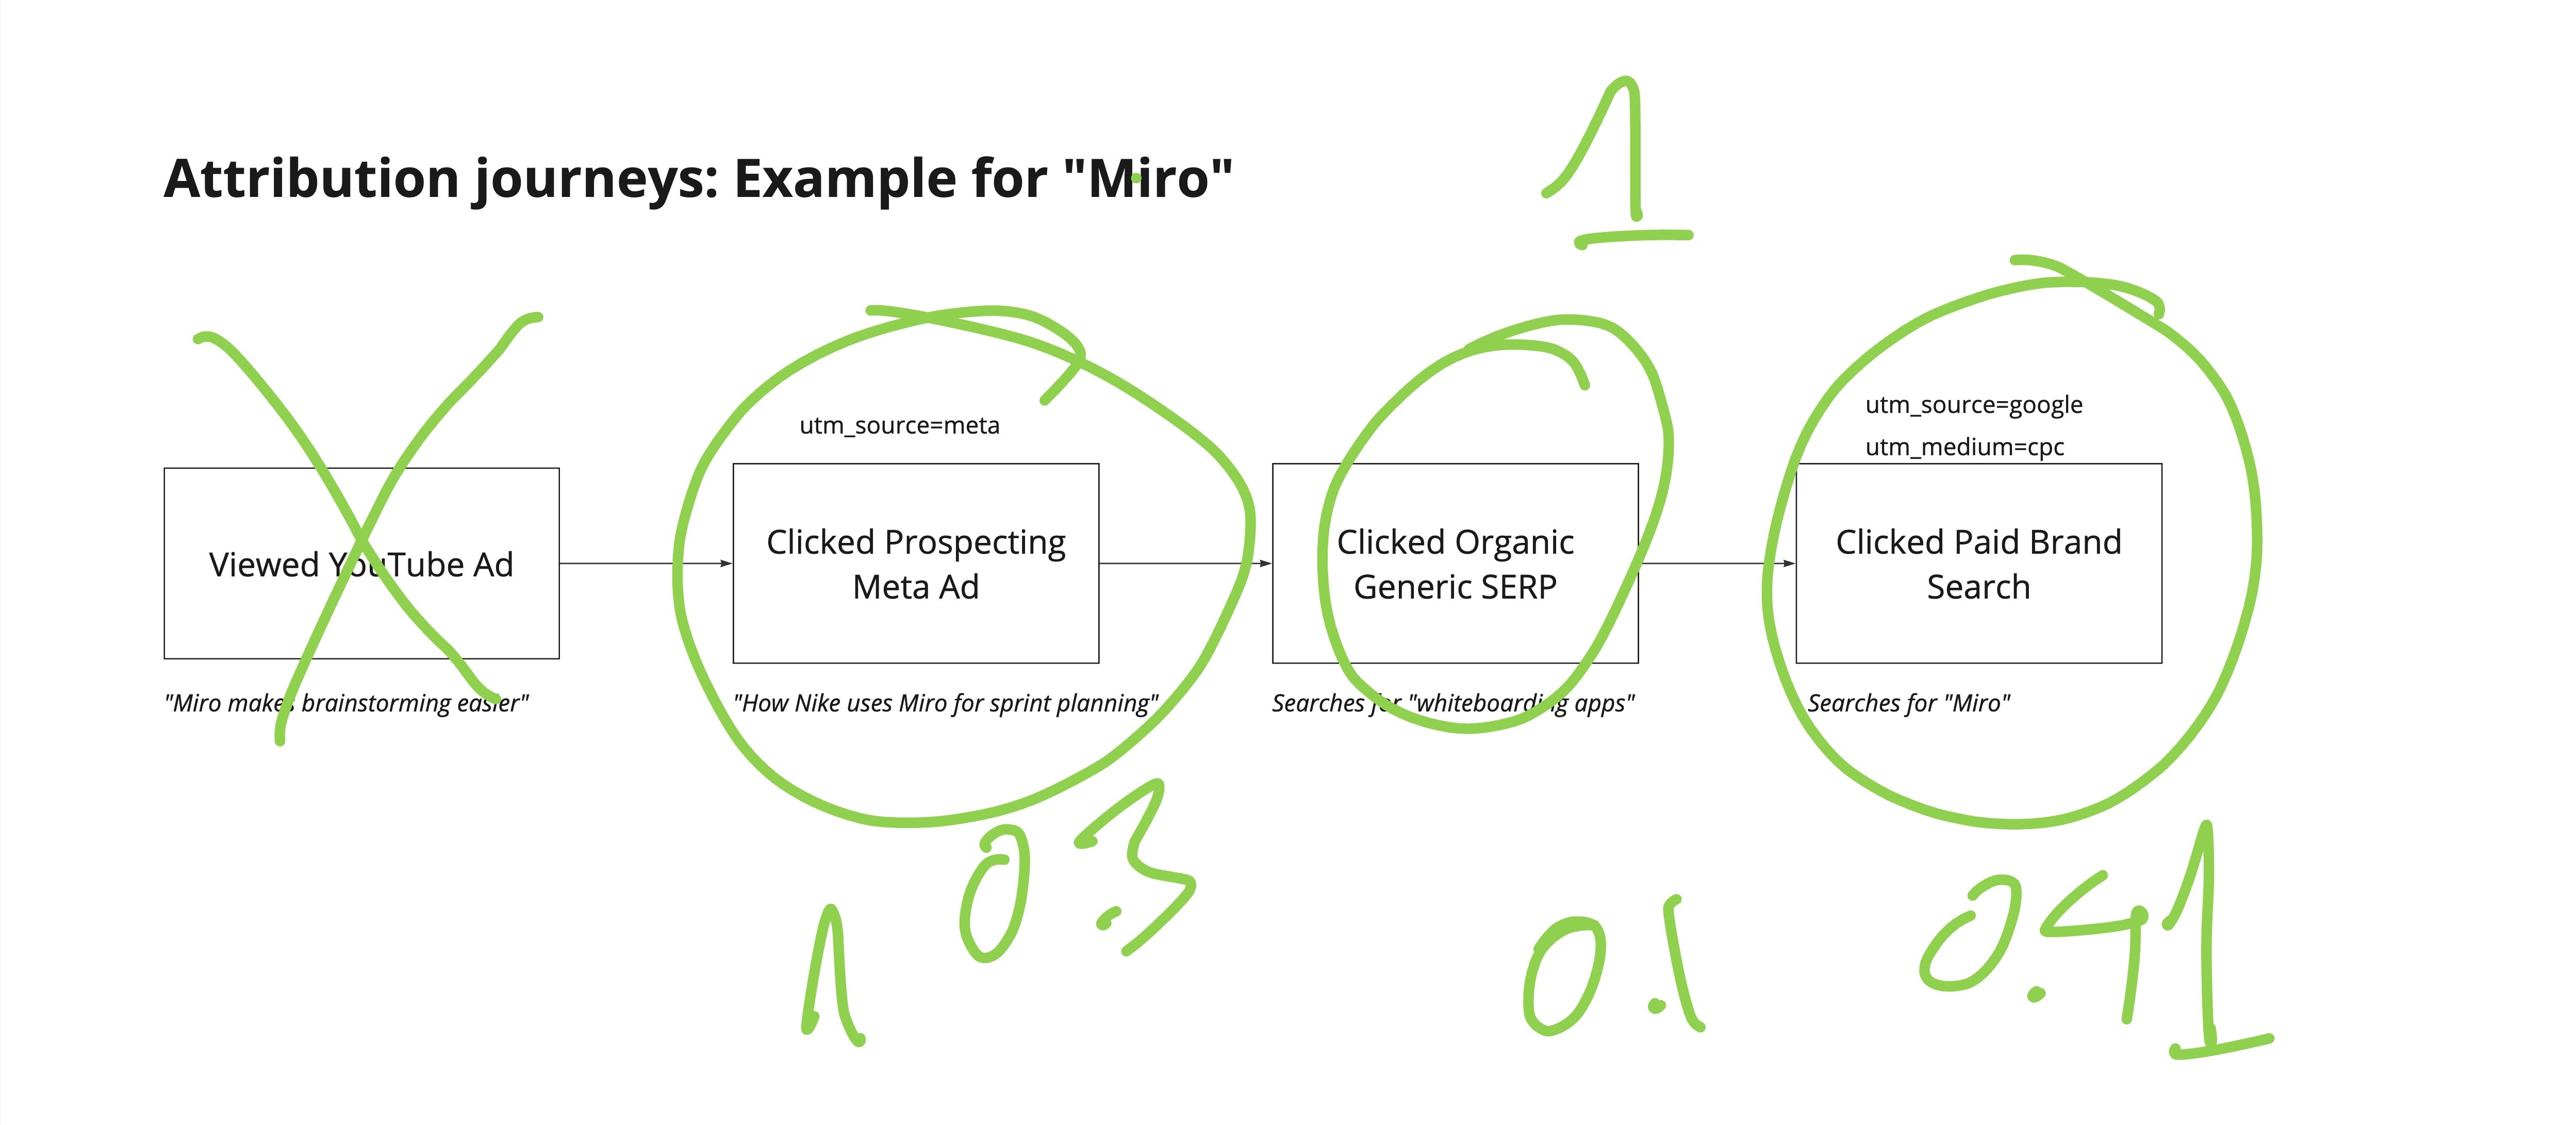
Someone sees your Meta ad on mobile during their morning commute. No click. They’re on the train. Three days later, they search your brand name on desktop at work and convert. Your analytics tool records a two-touchpoint journey: Brand Search → Direct. Your position-based model splits credit 40/40/20, giving most of it to search and direct. Meta, which created the awareness that led to that brand search, doesn’t appear in the path at all.
This isn’t a tracking failure. It’s an architectural mismatch. Impression-based channels like social, display, and video create awareness without requiring clicks. Intent-based channels like search and email capture existing demand with high click-through rates. When you feed only click-based touchpoints into MTA, you’re systematically overweighting demand capture and underweighting demand creation.
Cross-device (browser) journeys
Someone sees your YouTube ad on their phone, researches on their tablet two days later, and converts on desktop a week after that. Even with perfect cookie-based tracking, your analytics tool struggles to stitch this into one path. Most of these journeys collapse into “Direct” or “Organic” conversions in your reporting, which your MTA model then attributes to... nothing useful.
Most of these journeys collapse into “Direct” or “Organic” conversions in your reporting, which your MTA model then attributes to... nothing useful.
Cross-browser fragmentation creates the same problem even on a single device. A user clicks your Meta ad in the Facebook app (which opens in Meta’s in-app browser), browses your site, then returns hours later via Safari mobile to complete the purchase. Your analytics sees two separate sessions with different identifiers. The original Meta click never connects to the conversion. Your MTA model attributes the sale to Direct traffic, and Meta’s influence disappears entirely from your journey data.
This problem has gotten worse, not better. iOS privacy changes, cookie restrictions, in-app browsers, and the shift to mobile-first browsing mean more journeys fragment across both devices and browsers. Your MTA model doesn’t know these are fragments of the same journey, so it treats them as separate conversion events with artificially shortened paths. The channels that drove initial awareness, usually social and video, get systematically excluded from attribution.
View-through windows and platform logic
Meta counts conversions within a 7-click view and 1-day view window. Google Ads uses 30-day click and 1-day view by default. Your GA4 implementation might only count direct clicks with no view-through at all. These aren’t compatible measurement frameworks: they’re fundamentally different definitions of what “caused” a conversion.
When you export GA4 data into your MTA model, you’re processing journeys that already have Meta’s influence stripped out. The platform saw the impression, recorded the view-through conversion, and attributed it. But that impression never made it into your analytics event stream, so your MTA model can’t see it.
This Systematically Breaks Attribution
These aren’t random errors that average out, they’re systematic biases that consistently favor certain channels:
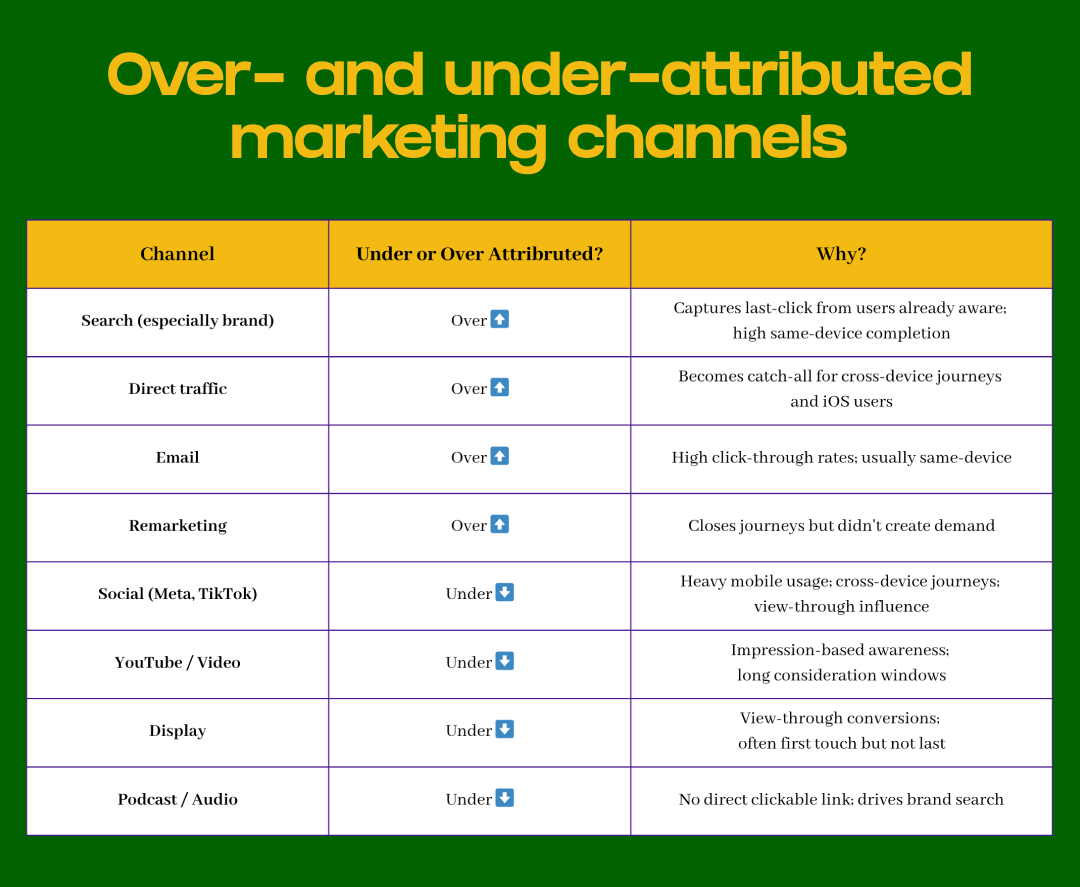
Your MTA model processes this biased data and produces attribution that makes search look brilliant and social look mediocre. It’s not measuring effectiveness. It’s measuring trackability.
This is why you need triangulated attribution: using multiple evidence sources to correct for systematic gaps in any single measurement system, then applying rules to operationalize those corrections.
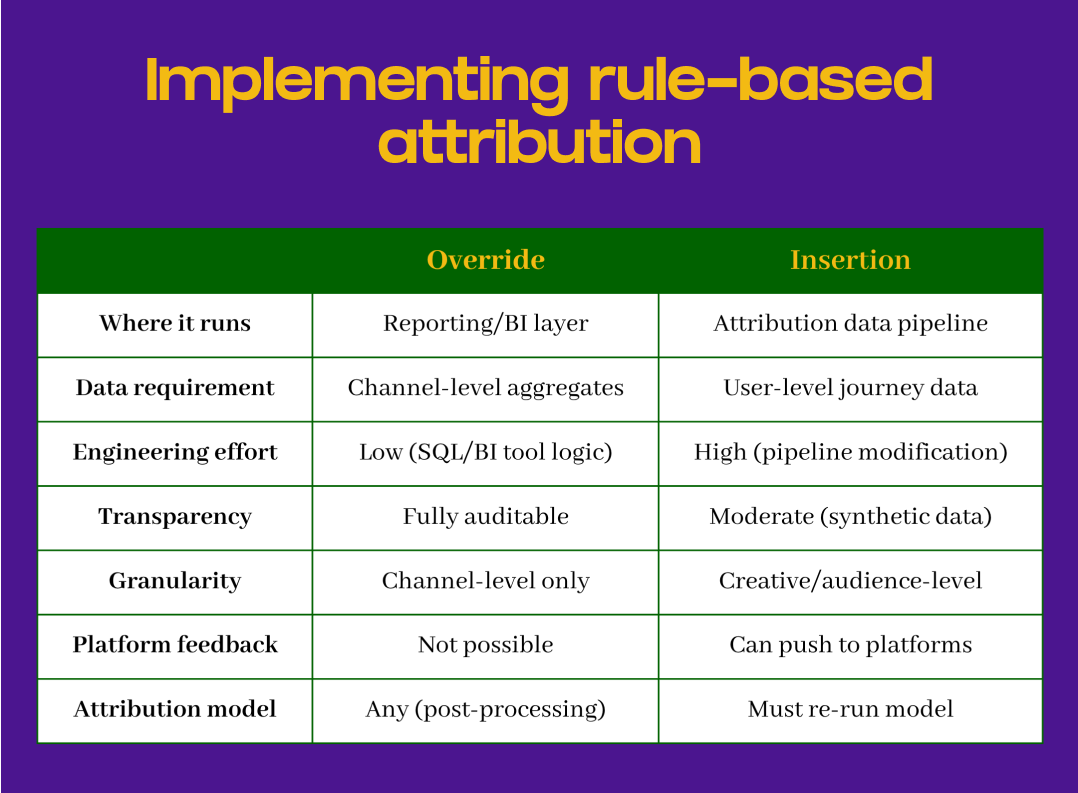
How triangulated attribution works: two implementation approaches
Triangulated attribution means combining evidence from multiple sources (incrementality tests, surveys, platform data) to reach a more defensible view of channel impact. The rule-based methodology operates at two different layers depending on your data maturity and what you’re trying to achieve.
Channel-level override: adjusting MTA outputs
Override happens after your MTA model runs. You take the attributed conversions from GA4, Snowplow, or your MTA platform and reallocate credit between channels based on triangulated evidence that certain channels are systematically under- or over-credited.
How it works: Run your MTA model as normal on your click-based journey data. It attributes 800 conversions across your channels, with Direct getting 200, Brand Search getting 180, and Meta getting 45. You know from a geo holdout test that Meta drove an incremental 120 conversions during this period. Your override rule shifts 75 conversions from Direct and Brand Search to Meta, proportional to their original attribution, to reflect Meta’s true contribution based on experimental evidence.
How to implement: This lives in your BI or reporting layer: Looker, Tableau, or SQL views in your data warehouse. You’re creating an adjusted attribution table that applies percentage shifts to your MTA outputs. For example, during Sept 1-14, multiply Meta conversions by 1.67 (from 45 to 75) and reduce Direct/Brand proportionally to keep the total at 800. Your dashboard pulls from this adjusted table instead of raw MTA outputs. The original data stays intact; you’re just adding a transformation layer for decision-making.
The tradeoff: you’re limited to channel-level corrections. You can’t provide platform-level feedback for optimization, and you can’t attribute credit to specific creatives or audiences. But implementation is fast and doesn’t require modifying your attribution pipeline.
When override makes sense:
Your user journey data is incomplete or poorly stitched
You need to reconcile reporting quickly for budget planning
You’re early in measurement maturity and need stakeholder alignment
You have strong evidence from incrementality tests but limited technical resources
Most organizations should start with this type of override. It requires less infrastructure, produces results faster, and is easier to explain to stakeholders. Only move to insertion when you’ve validated the override approach, have the data quality and engineering resources, and need the additional granularity.
User-level insertion: enriching journey data
Insertion happens before your MTA model runs. You add synthetic touchpoints to individual user journeys where triangulated evidence shows that a channel influenced the conversion but wasn’t tracked in your click-based data.
How it works: You have 500 Direct conversions in your GA4 or Snowplow data. Survey data shows 30% of Direct converters recalled seeing your YouTube campaign in the past week. For 150 of those Direct conversion paths, you insert a synthetic “YouTube impression” touchpoint 3-5 days before the Direct visit. Now you re-run your MTA model—whether that’s position-based, Markov chain, or Shapley value—and it redistributes credit across these enriched journeys. YouTube now gets attributed credit, and Direct/Brand Search automatically decrease because the model sees a longer path.
How to implement: This requires modifying your attribution data pipeline before your MTA model runs. The key decision is selecting which user journeys get synthetic touchpoints. Your method should match your evidence quality:
If your evidence is survey-based: Apply to survey respondents’ actual user IDs if you can match them, or randomly select 30% of Direct converters during the campaign period. Random selection assumes recall is evenly distributed.
If your evidence is from incrementality test: Insert touchpoints only for users in the test geo or segment where you measured the lift. Keep insertion aligned with where you proved impact.
If you have platform exposure data: Match user IDs between your analytics and platform impression logs. For users you know saw the ad, insert the touchpoint. Most accurate but requires data integration.
If you have limited data: Apply probabilistically—add a 0.3-weighted synthetic touchpoint for all Direct converters, or use temporal logic (insert for conversions 1-7 days after campaign flight).
You’re modifying your user journey table (adding synthetic touchpoint records with channel, timestamp, and user_id), then feeding that enriched data into your existing MTA model. The model doesn’t know these are synthetic. It just processes richer paths.
When insertion makes sense:
You have clean, stitched user journey data at the conversion level
You need to feed adjusted conversions back to platforms for algorithmic optimization
You want creative-level or audience-level attribution, not just channel-level
You have the engineering resources to modify your attribution data pipeline
Building triangulated evidence: combining multiple sources
The power of triangulated attribution comes from not relying on any single measurement system. You combine incrementality tests, survey data, and platform analysis to validate adjustments from multiple angles. Each evidence source has limitations, but together they point toward a more accurate view.
Incrementality tests: the gold standard
Geo holdouts and controlled experiments give you causal evidence of incremental impact. When Meta’s geo test shows an 18% lift in conversions, you know Meta is driving conversions that your MTA model is missing or misattributing to other channels.
Translation to rules: If the test shows +120 incremental conversions and your MTA model only attributes 45 to Meta, you have a 75-conversion gap. Your rule might shift 70-75 conversions from Direct and Brand Search to Meta during the test period. The conservative approach is to start with 80-90% of the measured lift to account for measurement error and external factors.
Critical consideration: Apply temporal boundaries. If the test ran for two weeks in Q3, your rule should only affect those two weeks unless you have evidence the effect persists. Don’t extrapolate a short-term test result across an entire year without validation.
Self-reported attribution: directional evidence
Post-conversion surveys asking “How did you hear about us?” provide evidence of awareness and recall, but they suffer from recency bias, social desirability bias, and attribution errors by respondents themselves.
Translation to rules: If 22% of converters recall seeing your YouTube campaign, that doesn’t mean YouTube deserves 22% of credit—it means YouTube had measurable awareness impact. A conservative rule might allocate 8-12% of conversions to YouTube, discounting for recall bias. The specific discount factor depends on how your survey is designed and validated against other evidence sources.
This is where triangulation matters: survey says 22%, you discount to 10-12%, then validate against YouTube’s platform-reported view-through conversions to ensure you’re in the right range.
Platform discrepancies: reconciliation signals
When Meta claims 1,200 conversions and your GA4 shows 600, the gap itself is evidence, but you need to understand what’s causing it before turning it into a rule.
Translation to rules: Don’t use the 2x multiplier directly. Instead, investigate: Are the attribution windows different? Is Meta counting view-through conversions your analytics misses? Is there cross-device behavior? If you validate through incrementality testing that Meta drives 800 conversions (not 1,200), use that as your rule basis. The platform discrepancy tells you where to look, not what adjustment to make.
This is triangulation in action: platform says 1,200, analytics says 600, incrementality test says 800. You build your rule around 800 because it’s the most defensible number.
Triangulation example: YouTube campaign
You’re running a major YouTube campaign and need to understand its true impact. Instead of trusting any single source, you gather multiple evidence streams:
GA4 attribution: 35 conversions attributed to YouTube (click-based only)
YouTube platform reporting: 340 conversions (e.g. 7-day click, 3-day view window)
Survey data: 28% of converters recall YouTube ad
Brand search lift: +45% increase during campaign flight
Geo holdout test: +18% incremental conversions in test markets
Your triangulated conclusion: Allocate 90-110 conversions to YouTube (conservative estimate from incrementality test), applied only during campaign flight dates. This reflects the 18% lift validated by the geo test, is directionally supported by the 28% recall rate and brand search lift, and falls well below YouTube’s claimed 340 (accounting for their aggressive attribution windows).
You’ve used five evidence sources to build confidence in one adjustment. No single source gave you the answer: the triangulation did. For sure, five sources is an overkill for most companies. So, start small: use MTA with a survey or an incremental test.
What actually changes: the competitive advantage
Triangulated attribution doesn’t reconcile numbers, it creates a measurable competitive advantage by making hard-to-track channels measurable and defensible.
Most companies systematically under-invest in social, video, and display because these channels look terrible in click-based MTA. Your competitors are making the same mistake. When you implement triangulated attribution using multiple evidence sources, you can see their true impact and invest accordingly while competitors keep cutting these channels based on incomplete data.
This is particularly powerful for channels with long consideration windows or heavy cross-device behavior. You’re able to defend budgets for YouTube campaigns that drive brand awareness, knowing the conversions will show up as “Direct” or “Brand Search” in raw attribution but being able to correct for that systematically using experimental evidence.
The competitive advantage isn’t just better measurement: it’s the willingness to invest in channels your competitors can’t measure properly.
The competitive advantage isn’t just better measurement: it’s the willingness to invest in channels your competitors can’t measure properly.
“All models are wrong, but some are useful”
Triangulated attribution isn’t perfect measurement. It’s a pragmatic measurement that acknowledges every single data source has systematic biases, and corrects for them by combining multiple evidence streams into a more defensible view.

Your GA4 or Snowplow or custom MTA platform will continue to under-attribute impression-based channels and over-attribute last-click channels. Your ad platforms will continue to claim credit for everything within their attribution windows. Your surveys will continue to have recall bias. That’s fine. You’re not looking for a perfect source. You’re looking for convergent evidence from imperfect sources that collectively points toward a more accurate answer.
The goal is consistent attribution that’s good enough to make better decisions than you’re making today. Start simple: pick one channel where you have strong evidence of under-attribution: usually social or video. Run an incrementality test. Collect survey data. Compare to platform reporting. Build one override rule based on triangulated evidence. Validate it with stakeholders. Then expand to other channels as you build confidence and gather more evidence streams.
The alternative is continuing to optimize click-based MTA outputs that systematically misrepresent your marketing effectiveness or relying on hunch alone. Your competitors are making budget decisions based on incomplete data from single sources. You don’t have to.