


First things first: This article was written with Sofía Valcárcel, who works at a past customer of mine. She spent seven years in product and marketing roles before moving into data science, with experience at companies like MediaMarkt and Nestlé. Today, she designs and runs marketing measurement and incrementality experiments across international markets & works with founders as a Data Strategist, helping them make better decisions with the data they already have.
The first incrementality test I worked on in Austria would not have worked. I wanted to know how much extra spend on Meta would really add, and the plan was to use the country’s nine federal states as test and control groups. But nine states didn’t give me much to work with. Each one had too little volume, and sales moved too much from one week to the next. Even if the extra spend drove more sales, the test might not have captured it. I would have ended up with an inconclusive result and no way of telling whether the channel did nothing or the test was too weak to show it.
I’ve run these tests in Brazil and in several European countries, and most of the hard work happens before launch, when you check whether the design can answer the question at all. In Brazil, with large regions and plenty of volume, that check is usually quick. In Europe, it often fails. Countries are smaller, so there’s much less volume to split between test and control. A design can look perfectly sensible and still be unable to detect the effect you care about.
This article is about region-based tests, where you change spend in some areas and compare them with the rest. I’ll cover what determines whether one of these tests can work, what you can adjust when it doesn’t, and how I got the Austrian test to the point where it could give me an answer.
So… what is an incrementality test actually measuring?
An incrementality test tells you how many of your sales (or registrations, or whatever conversion you care about) happen because of a specific channel or campaign. In a region-based test, you change spend in some geographic areas, like regions or cities, and leave the rest alone. Then you compare. Think of an A/B test where the groups are places instead of users.
This is very helpful because your usual reports can’t tell you which sales a channel actually caused.
This is very helpful because your usual reports can’t tell you which sales a channel actually caused. Most attribution gives the credit to whatever the user clicked last, so a channel can look great even when plenty of those customers would have come anyway.
Brand search is a good example. In Austria, the last-click reports gave it a lot of credit, and I suspected that much of that traffic overlapped with SEO. Someone searching for the brand would probably have found it through the organic result even without the ad. It seemed to be a cannibalization case.
I think most confusion comes from what people expect from this type of test. Usually, teams are waiting for a verdict. The channel works, or it doesn’t. Keep the budget or cut it. Instead, you get a number. It tells you how much your sales grew or dropped because of a specific spend decision, in the regions you tested and over the weeks the test ran. Increasing spend in a few regions tells you something quite different from switching the channel off.
There are other ways to inform budget decisions, like marketing mix models or platform lift studies, but I’ll leave them aside here. I prefer region-based tests because they give me full control. I decide where spend changes, and the result doesn’t depend on last-click or on how a platform credits its own conversions. It comes from a change I made myself, not from historical patterns.
It’s still an estimate, though, and estimates come with uncertainty. This is why reading the result as a simple yes or no can be misleading. When a test can’t detect an effect, it’s tempting to conclude the channel doesn’t work. But sometimes the test never had a chance to see it.
What does a geo-experiment need to work?
So what does a test need to see anything at all? The basic setup is very similar to a traditional A/B test. You split your regions or cities into two groups. In the test group, spend changes. In the control group, everything remains the same.
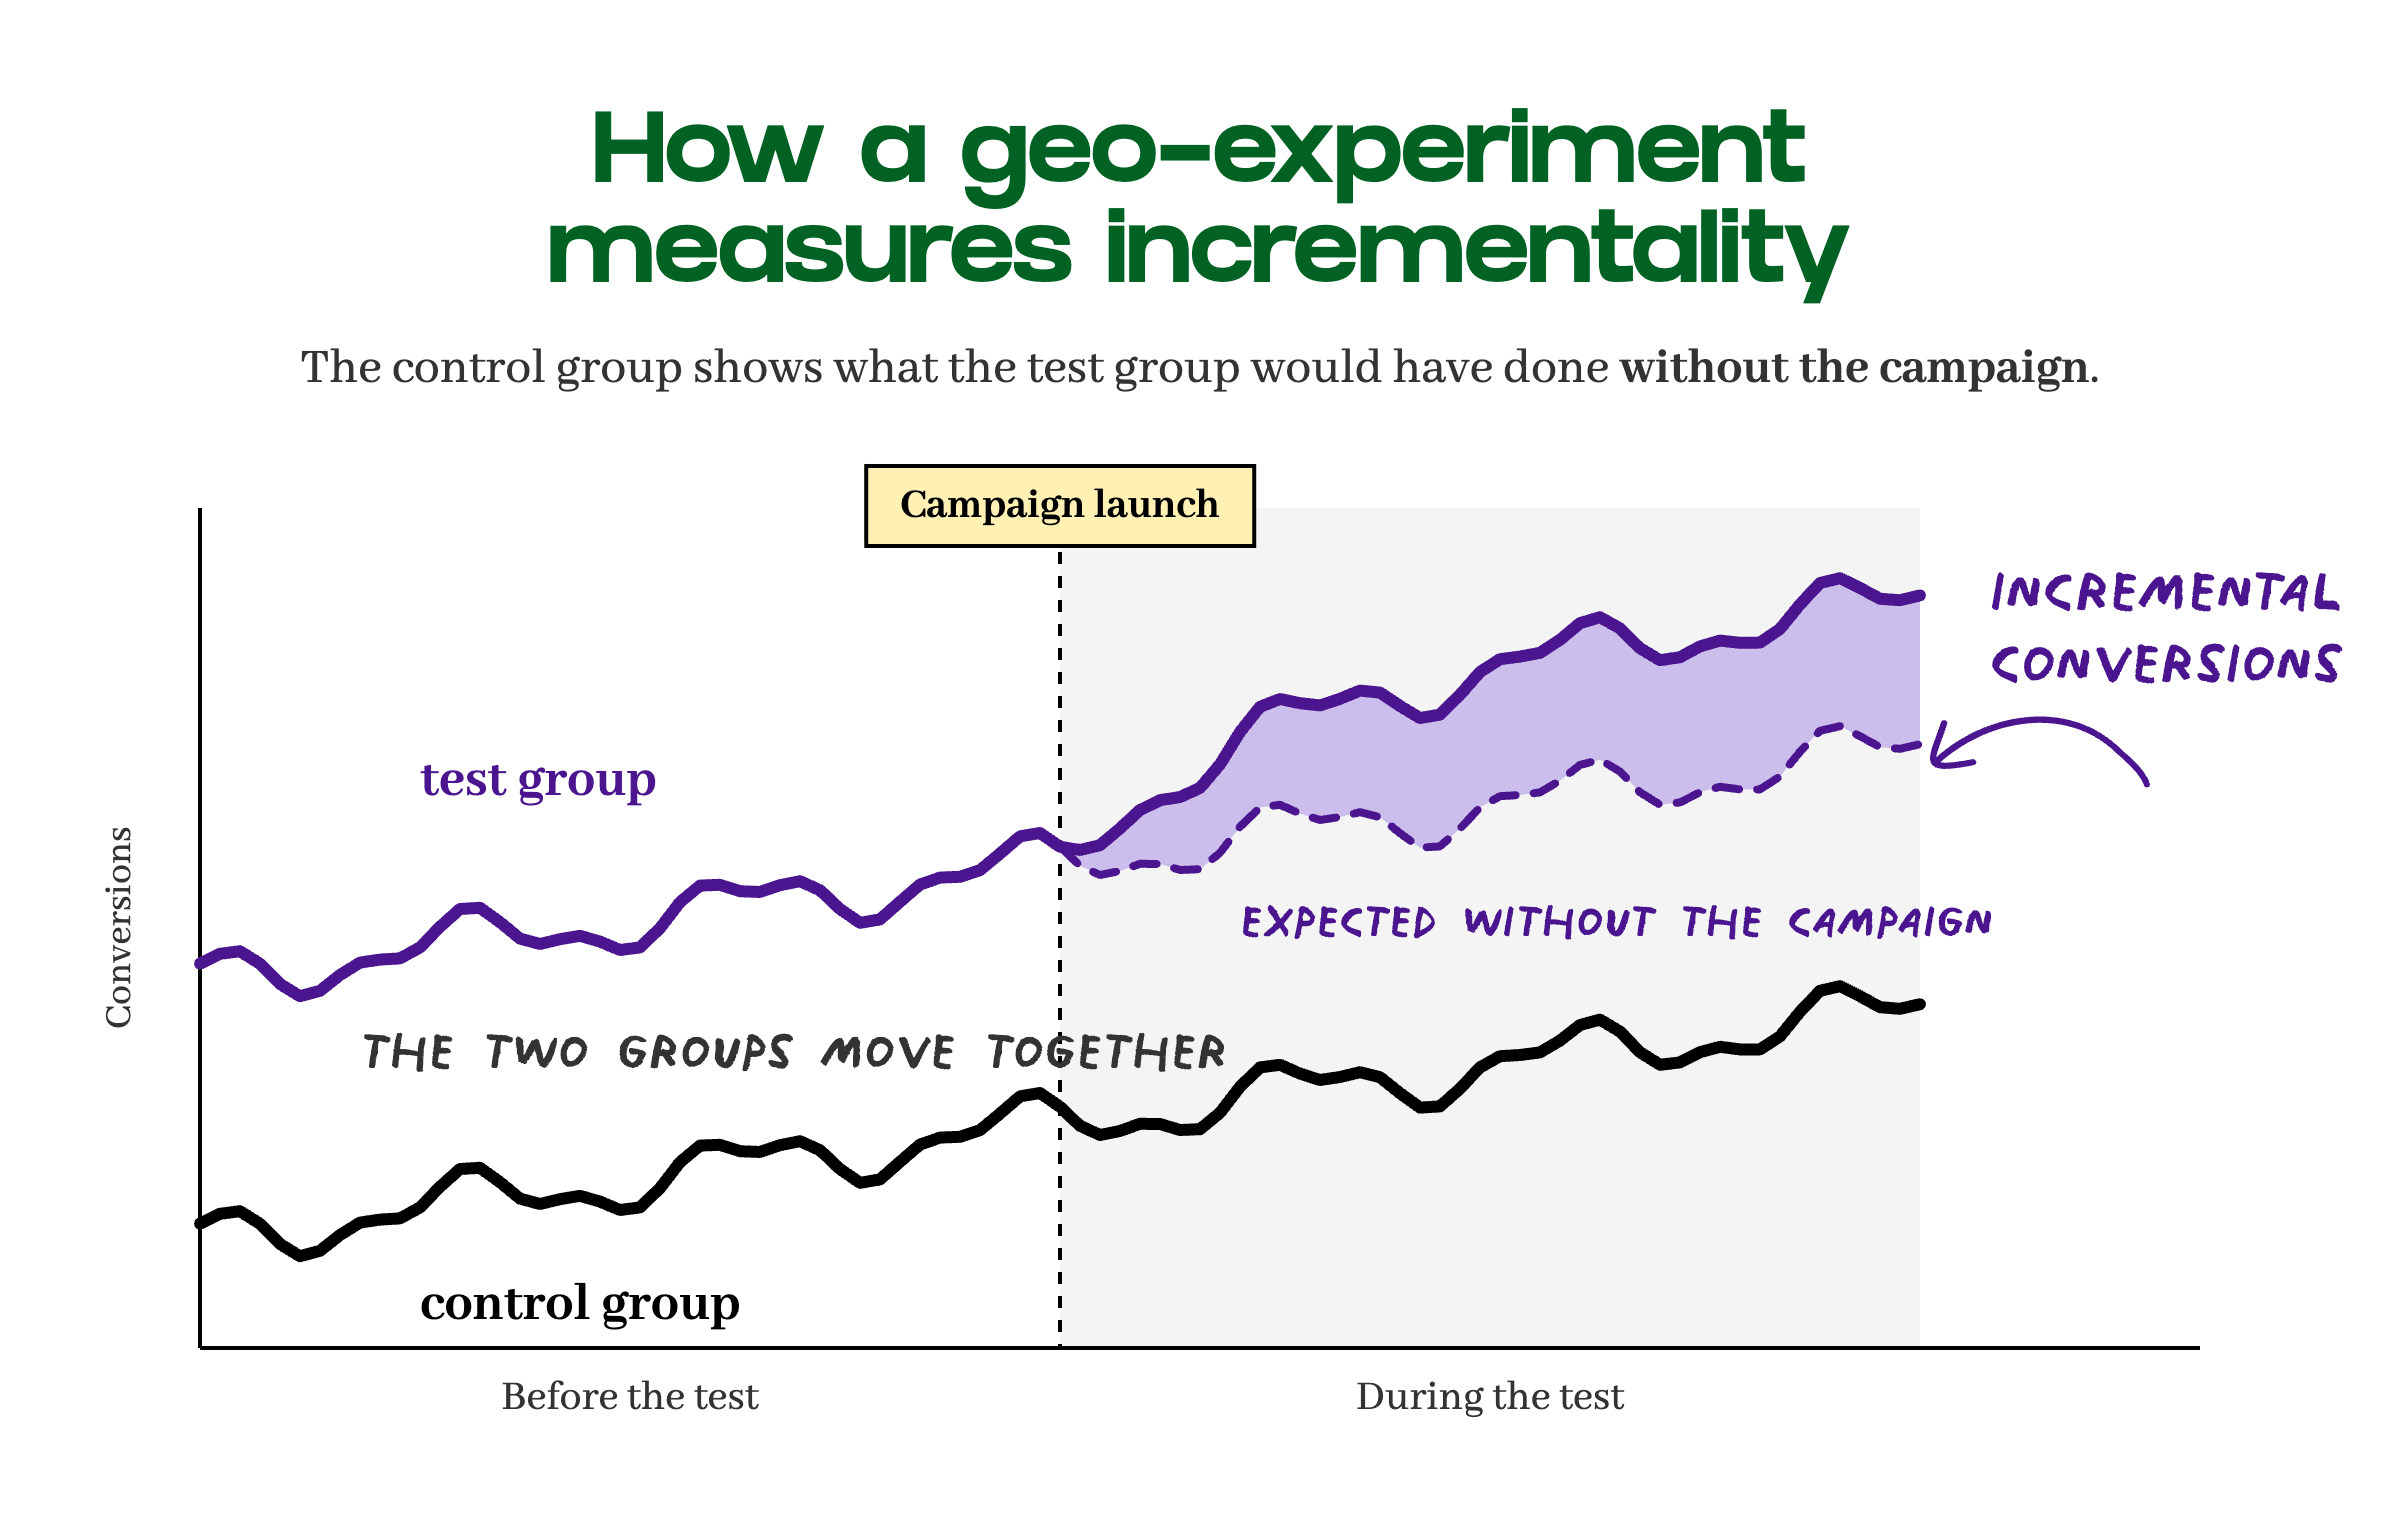
The control’s job is to show what the test regions would have done without the change, and it can only do that if the two groups move together. This is called parallel trends, and it’s essential for a successful geo-experiment. A big football weekend should push both up, and a slow January should pull both down. If the two groups moved together in the past, you can trust the control during the test.
There’s one more thing to pay attention to. If ads from the test reach the control, or vice versa, the difference between the two groups shrinks. This happens more often than you’d think, especially in small countries, where many people live in one region and work in another. When I work with smaller units like cities, I group neighboring areas into clusters. That way, each cluster can still be targeted on the platforms, and most people who live in one town and work in the next stay inside the same cluster.
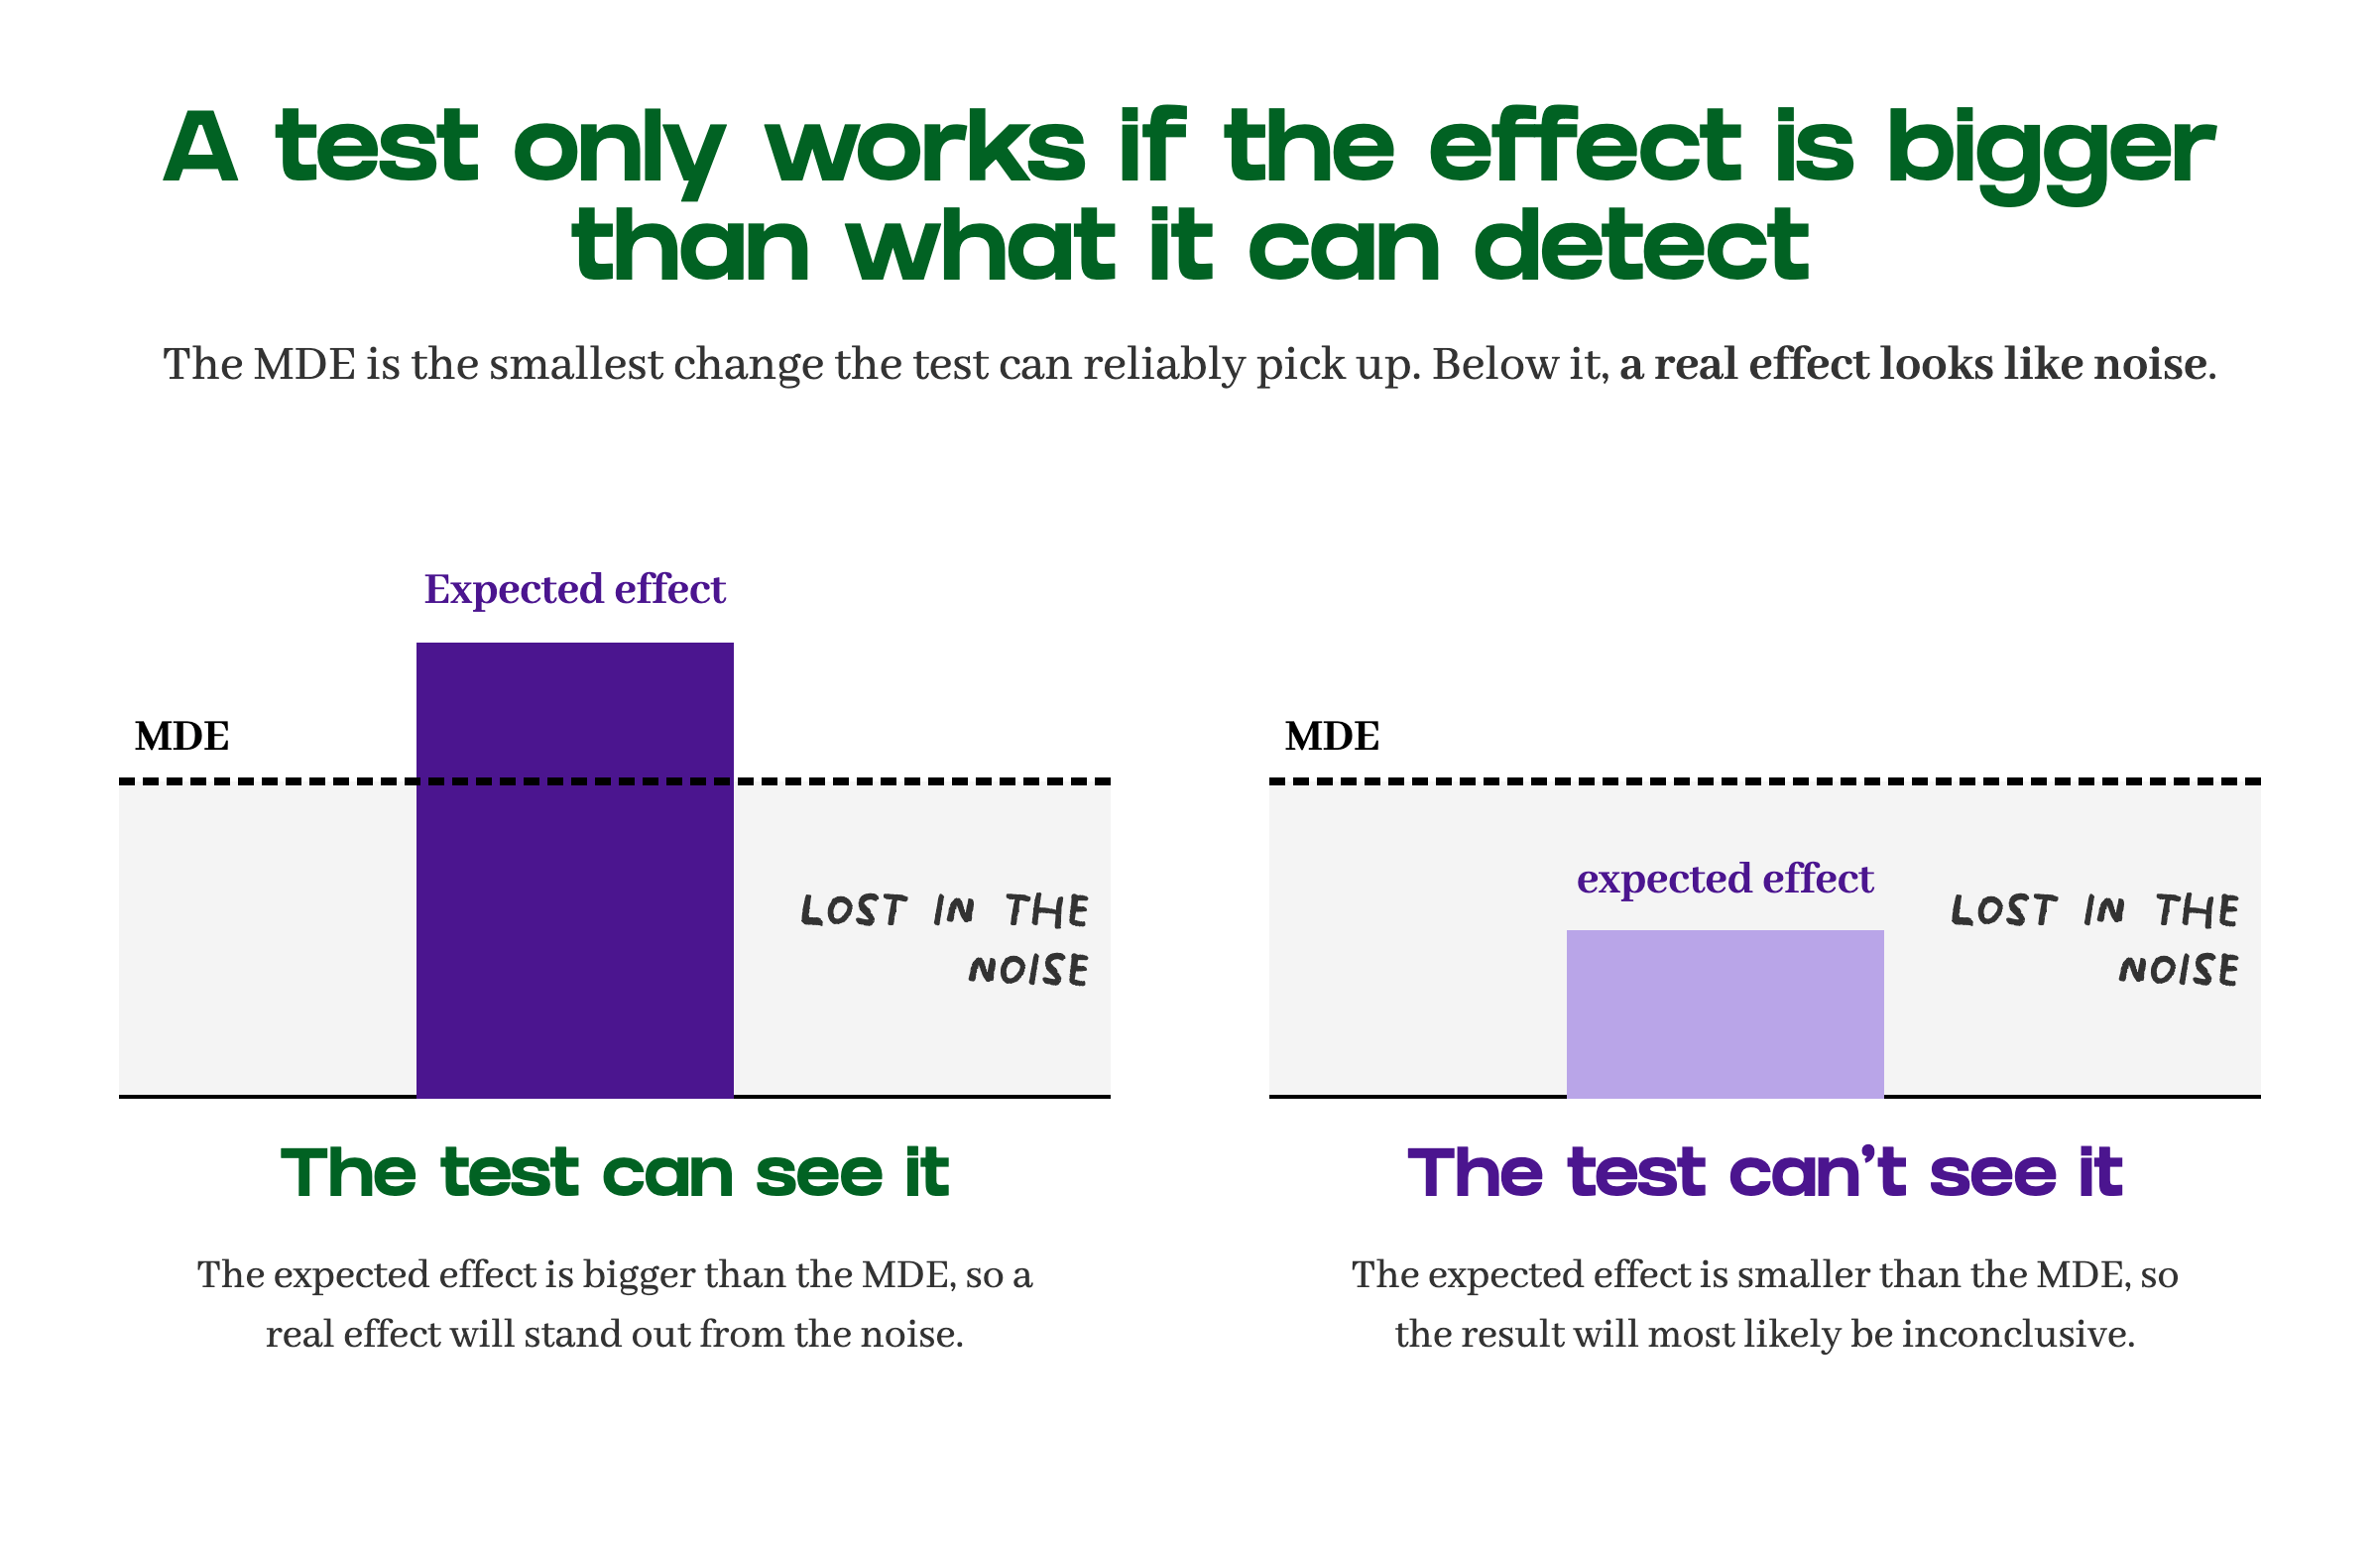
This brings me to the number that decides whether any of this can work: the minimum detectable effect (MDE). It’s the smallest change in your metric that the test can reliably pick up, which is why some people call it the test’s precision. If the real effect is smaller than the MDE, the test will most likely come back inconclusive, no matter how well you run it.
In practice, the better the control predicts the test group before launch, the smaller the effect you can detect. The MDE also decreases with more regions and more weeks, and increases with noisier data. So before launching, you want the effect you expect from the channel to be comfortably larger than the MDE.
How big that effect is depends partly on how you change spend. There are two main ways to do it.
A lift test increases or reduces spend in the test regions. It tells you what that extra (or missing) money does.
A holdout switches the channel off entirely in the test regions. It tells you what the whole channel contributes.
They answer different questions. If someone wants to know whether to add budget to a channel, run a lift. If they want to know what the channel is worth, run a holdout. A lift that finds little effect may only mean the extra spend didn’t add much, not that the channel itself does nothing.
What actually makes a market testable
Population tells you very little about whether a geo-experiment will work. Austria has around nine million people, which sounds like plenty. What the test actually works with, though, is the number of conversions in each region or city, week by week. That depends more on how much of the market you already have than on how many people live there.
Low volume shows up as noise. When a region produces only a handful of conversions a week, small random swings look large, and a real marketing effect gets lost in them. In Austria, a typical municipality brought in about one registration a week. At that level, the weekly series is almost pure noise.
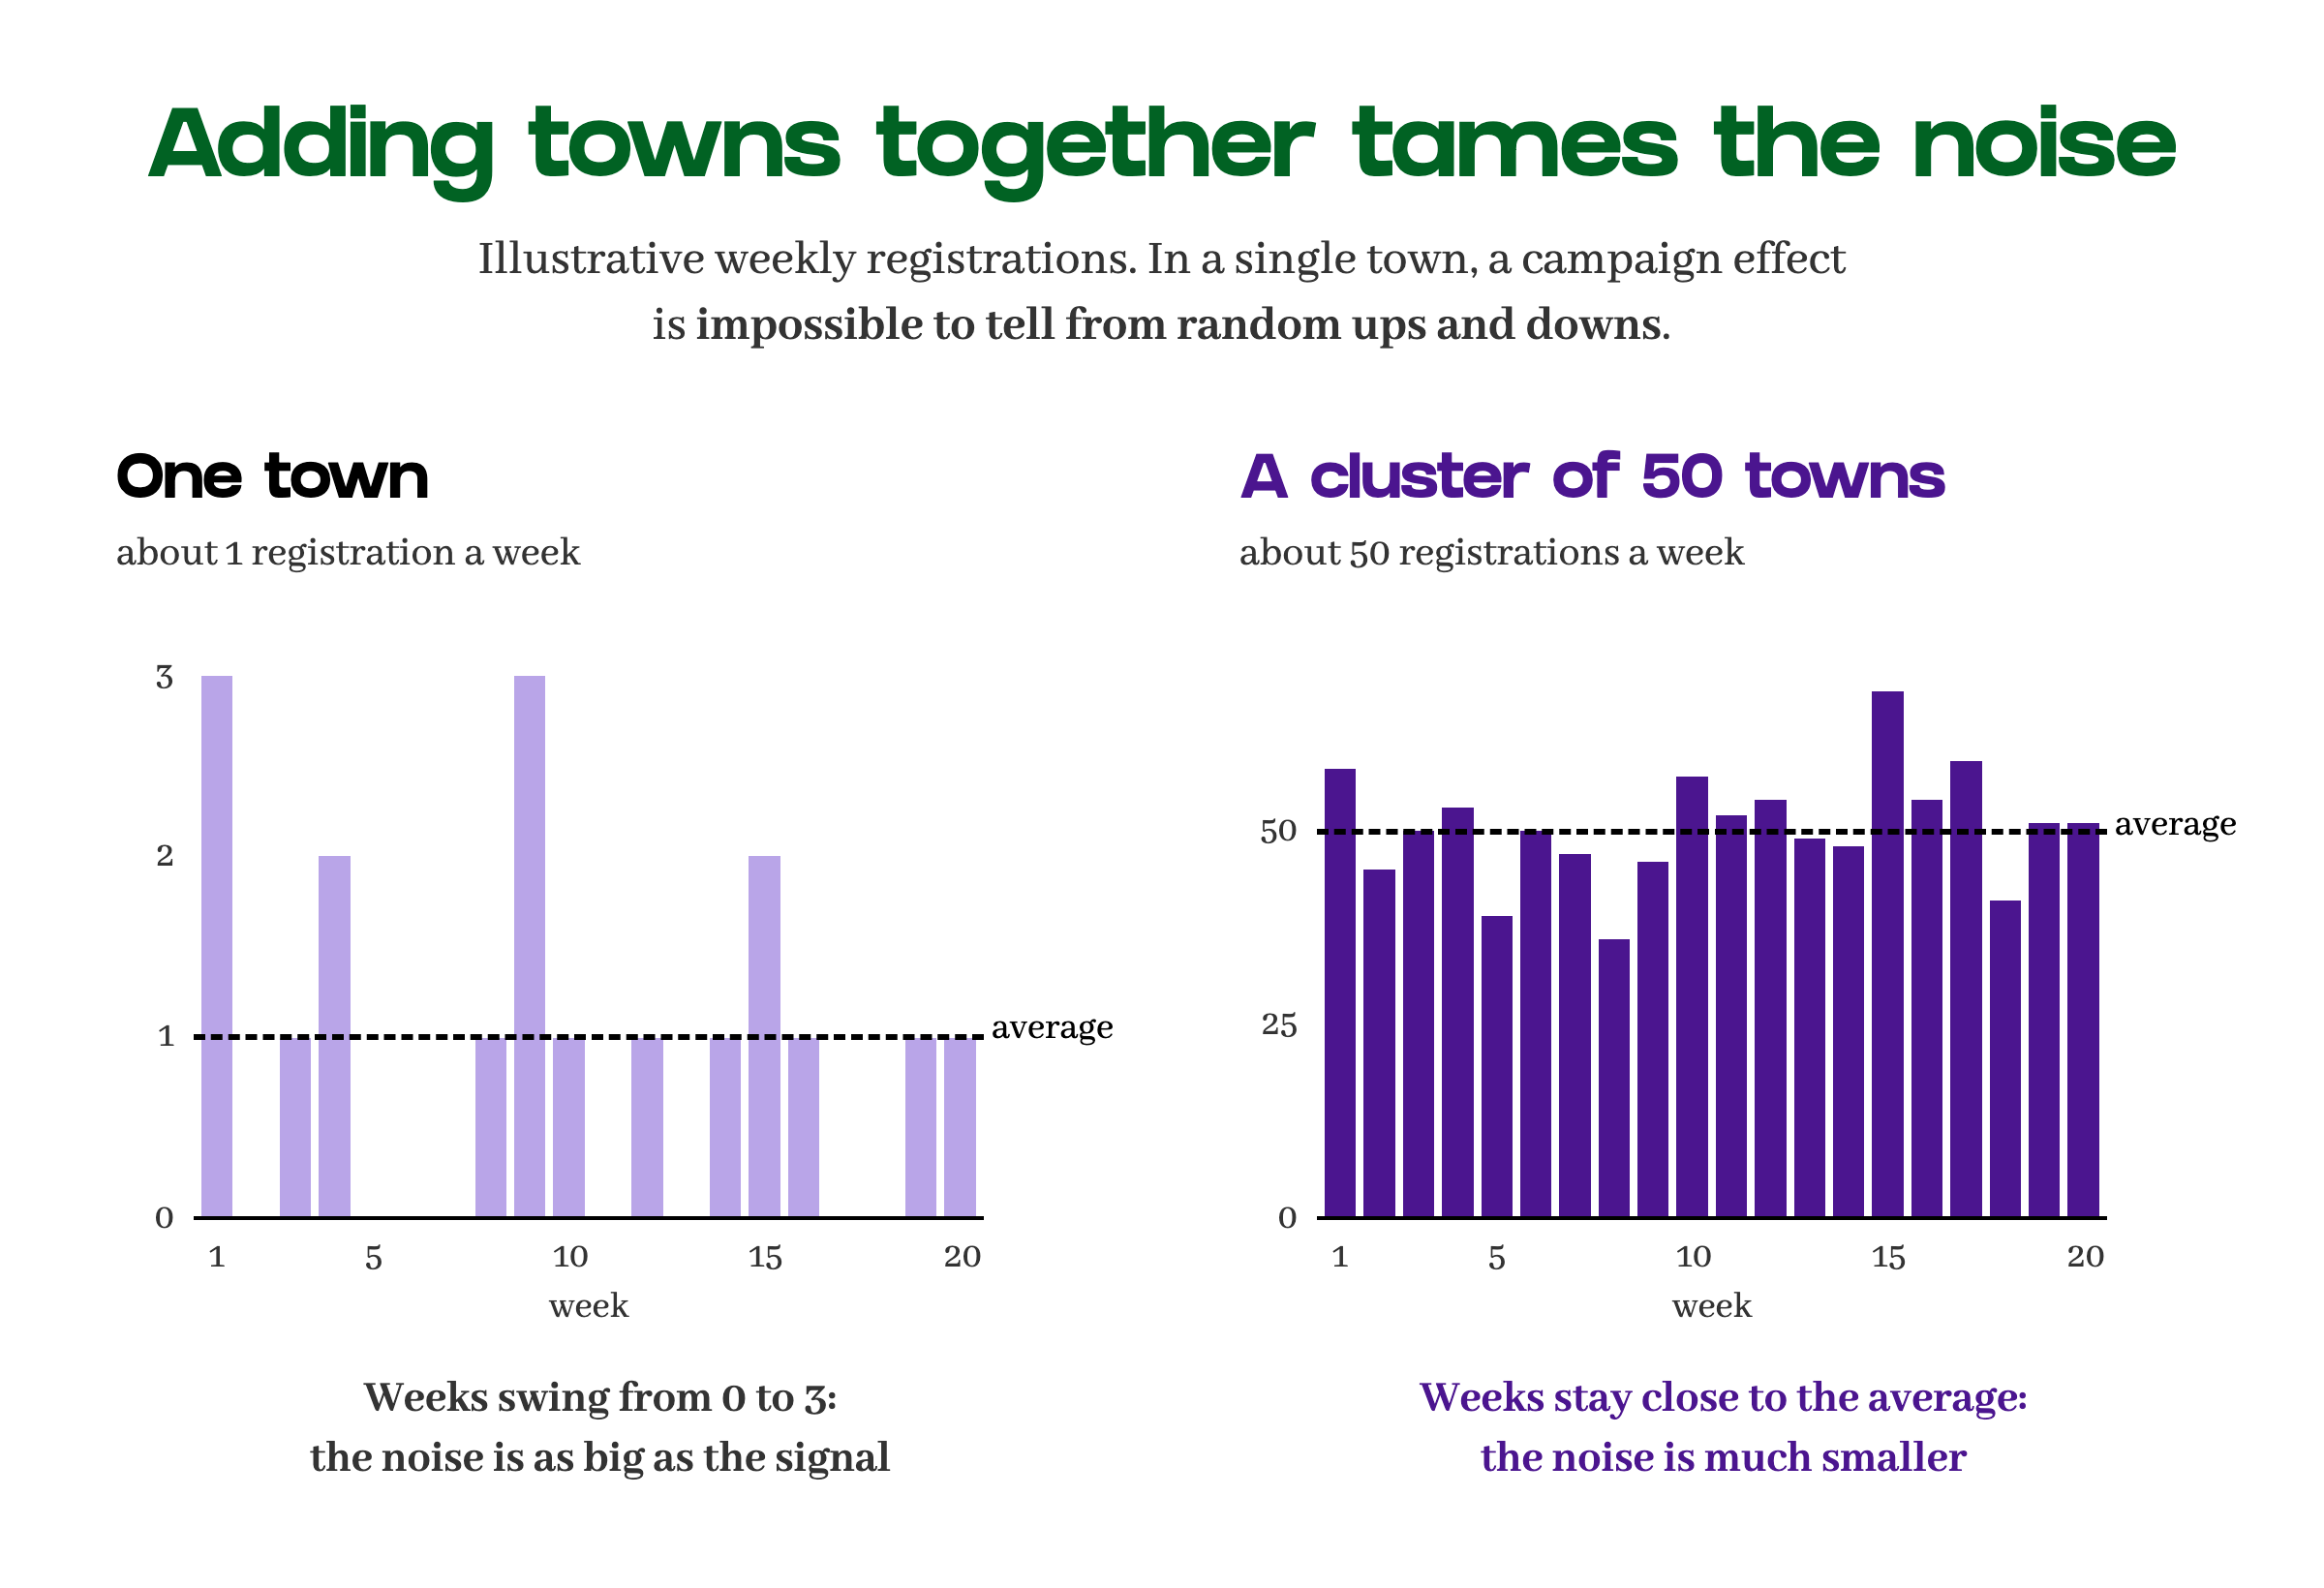
That’s why I group cities into clusters, so each unit has enough volume to work with. Clusters also give you more flexibility than administrative regions. They don’t have to follow territory alone, so you can account for other factors, such as language or socio-demographics. And you often end up with more units to split between test and control. In Austria, instead of the nine federal states, I ended up with 12 clusters.
Market maturity also changes where volume comes from. In an established market, most of your customers already know you, so there are fewer new ones to win and more existing ones to keep. That’s what happened in another small market I worked with. Registrations had flattened out, and a test built on them would have had almost nothing to move. I had to switch the target metric to reactivated users, which is where the activity actually was.
Being close to the conversion doesn’t make a channel easy to measure, either. Take the brand search example from the beginning. In a test I ran, a large portion of its traffic returned through organic search once the ads were off in the test regions. The channel looked huge in the reports, but its real incremental effect was much smaller.
Demand spikes limit your testing windows
Every business has its own calendar cycle. In e-commerce, Black Friday and Christmas can concentrate a big share of the year’s demand into a few weeks. Travel has its summer, education has back-to-school, and anything connected to sport moves with the big tournaments and finals. These peaks are part of how the business works, so the test has to fit around them!
Sales going up in both groups at the same time isn’t a problem. If everyone buys more because of a big event, the control goes up too, and the comparison still works. What breaks a test is when only one of the groups changes. Maybe there’s a local sponsorship in one city, or someone launches a promotion in a single region. So before every test, the teams need to leave local budgets alone until it’s over. Most of the time they do. But if someone changes the budget on the test campaigns halfway through, those weeks end up completely biased.
Peaks also make the results much harder to read. During a brand search test in Brazil, Carnival and several big football finals fell in the middle of the test. Everything I’d calculated beforehand assumed normal weeks. During the peak, sales were much higher and jumped around far more, so whatever effect switching off brand search had was buried under all that movement.
I only rescued the test because I could look at organic search on its own. In the test regions, organic registrations shot up as soon as the ads were off. And even if a test run during a peak shows a clear result, I wouldn’t trust it for the rest of the year. Auction prices are higher, competitors spend more, and there are promotions everywhere.
If only a couple of weeks are affected, I can sometimes remove them or adjust them, both during the test and in the historical data I use to plan it. But every week I remove is data the test loses, so this only works up to a point.
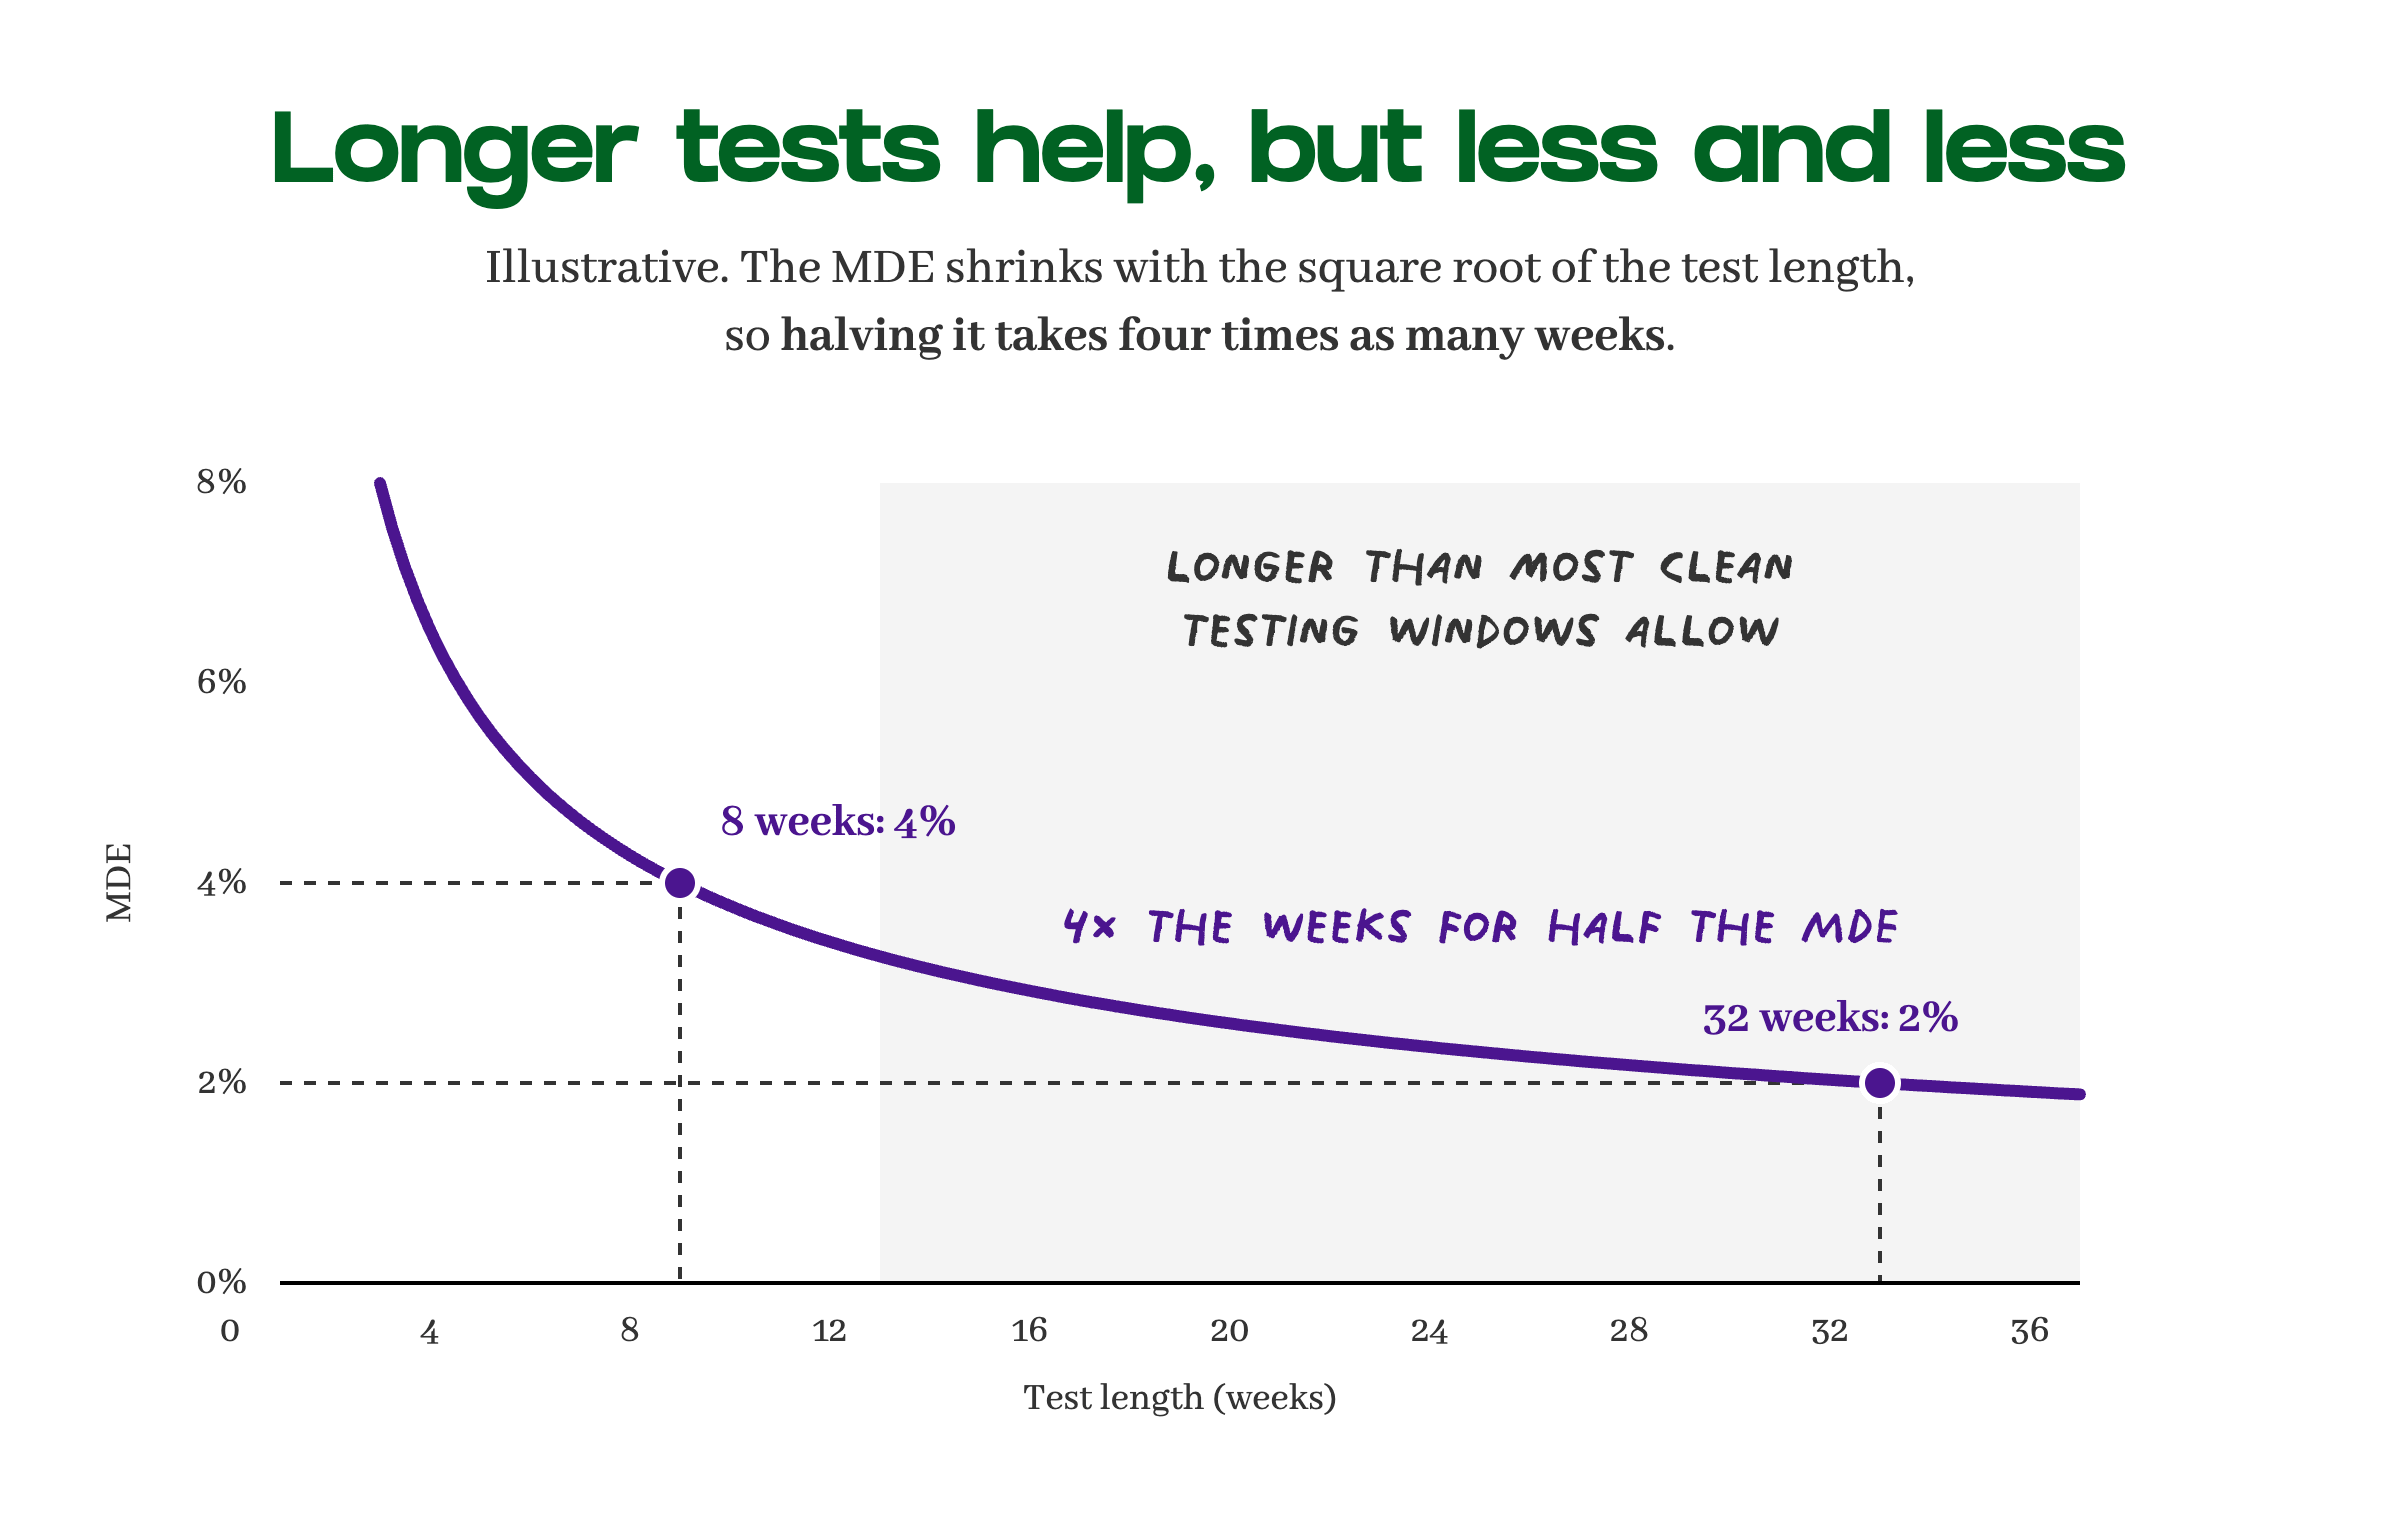
Running the test for longer helps, but less than you might expect. As a rough rule, the MDE shrinks with the square root of the test length, so cutting it in half takes about four times as many weeks. If a test can detect a 4% effect in eight weeks, getting down to 2% would take around 32. And since most markets only have a few clean testing windows a year, running a test that long is rarely an option.
All the constraints from the last few sections apply everywhere. In Europe, they just leave you much less room.
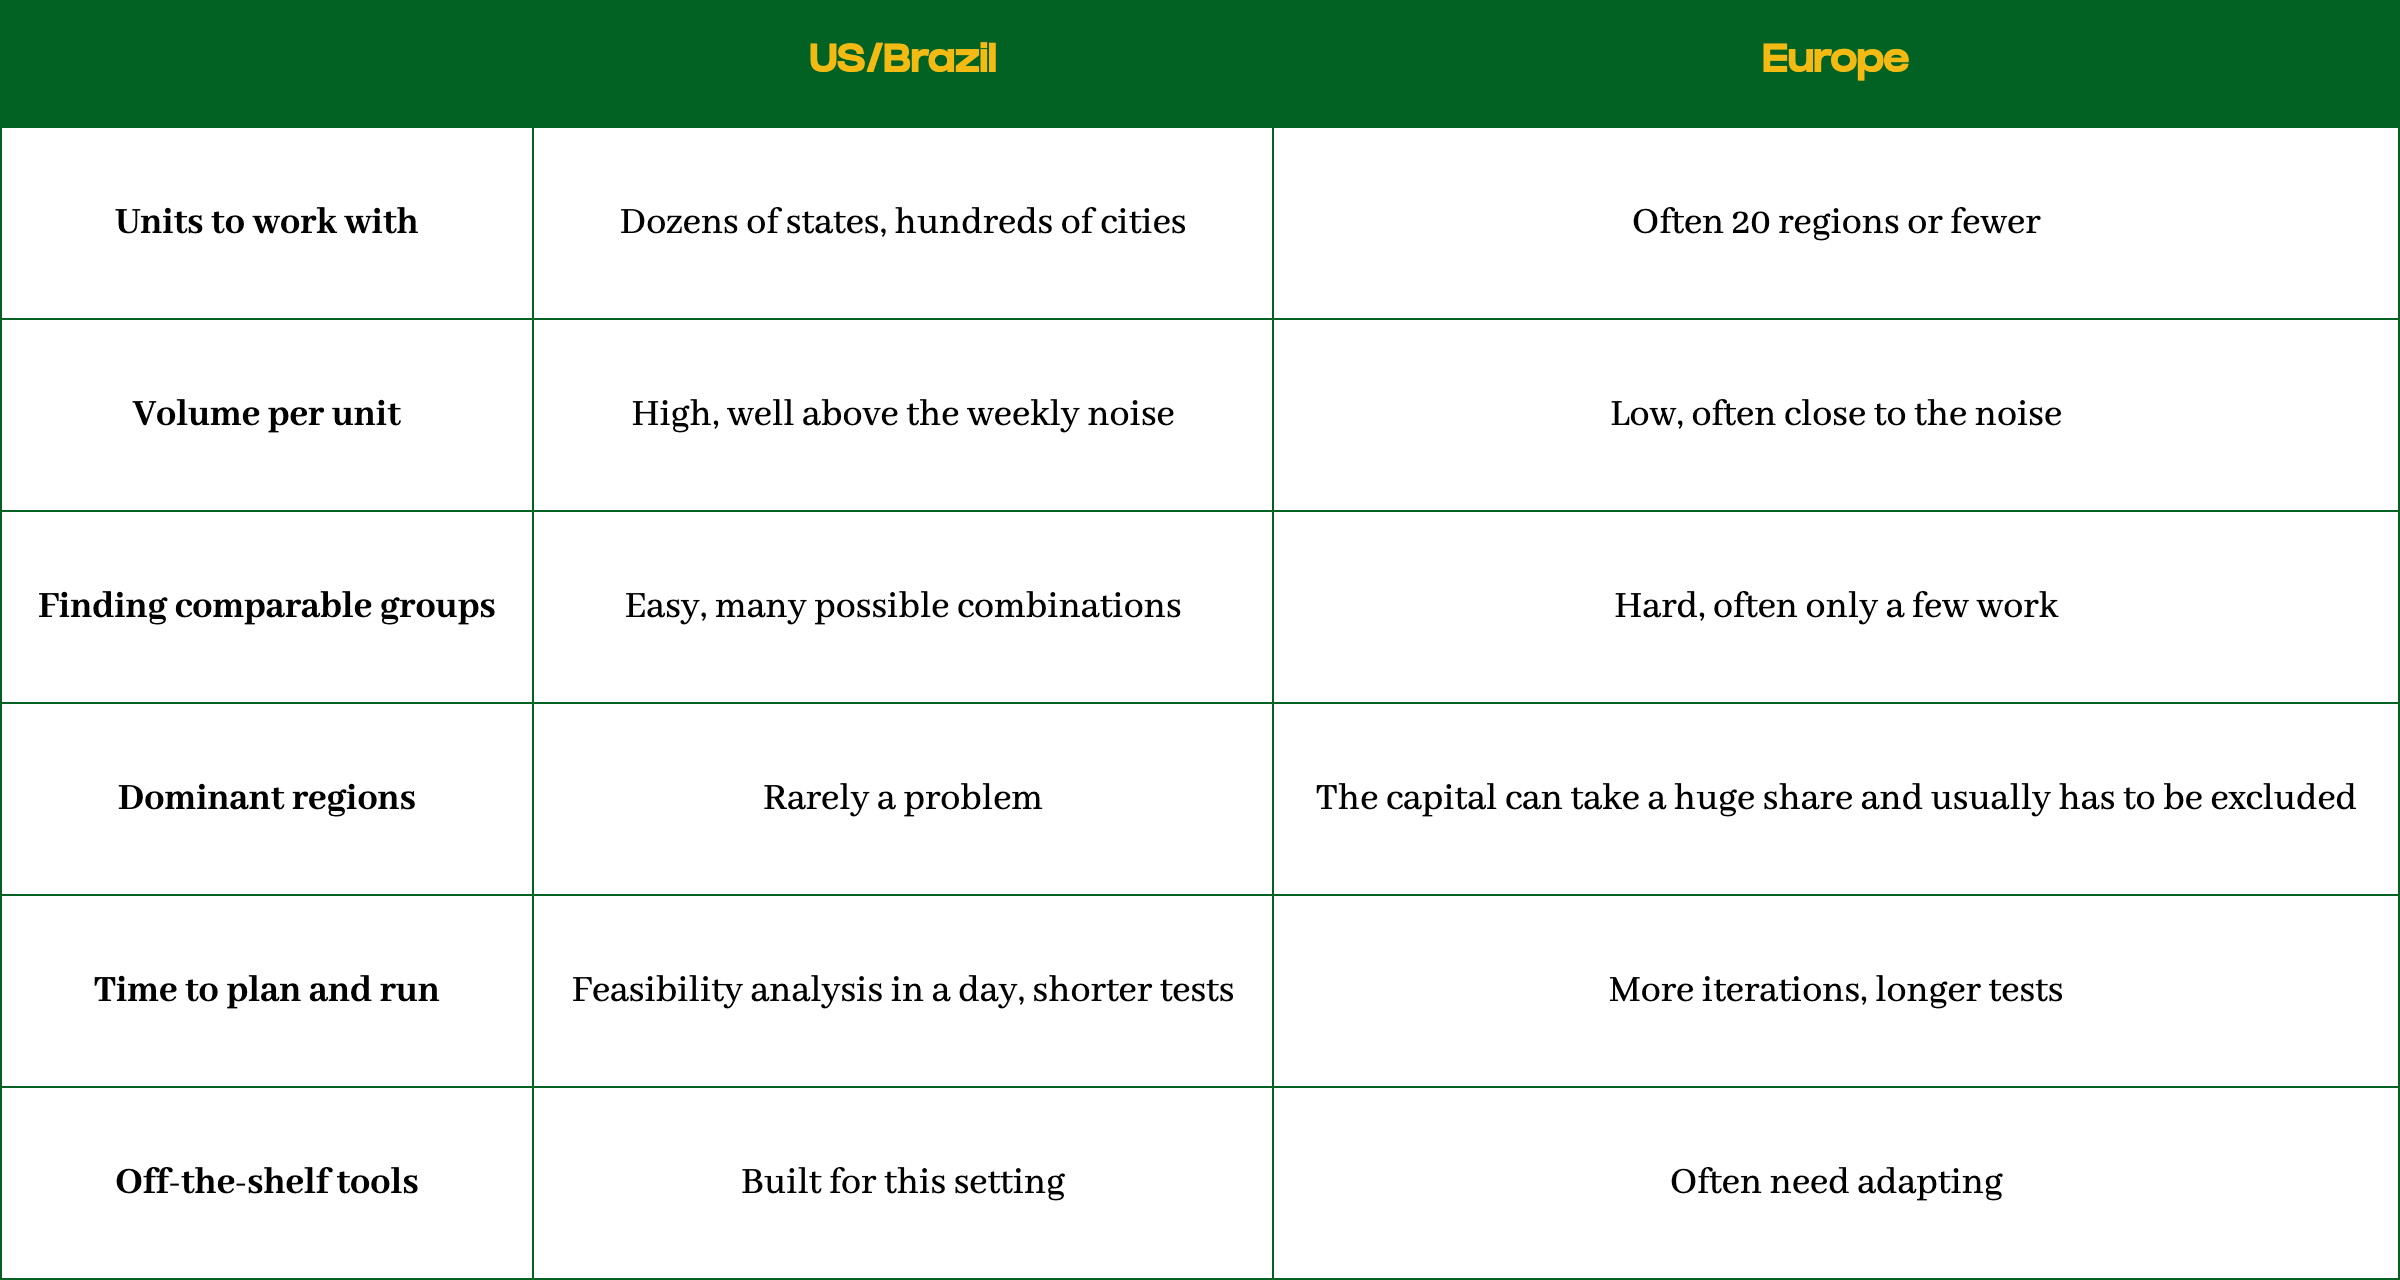
Why is this harder in Europe than in the US or Brazil?
Most geo-experiment literature assumes a large market like the US or Brazil, with many states, plenty of volume, and lots of candidates for a control group. In Brazil, almost everything was easier. The volume was so high that I could run tests with three groups instead of two. Tests were shorter too, because more volume gets you to a usable MDE faster. The regions are very different, but they tended to move similarly, so it was easy to find groups that tracked each other, and the MDEs came out relatively low.
Europe is a different story. Countries are smaller and split into fewer regions. Austria has nine states, the Netherlands twelve provinces, and Poland sixteen voivodeships. Fewer regions don’t mean bigger or more useful ones.
In many countries, the capital takes a huge share of the volume. For example, in Austria, Vienna alone accounted for a large share. A region like that is very hard to use in a test. The control is built from the other regions, and when one region is as big as the rest of the country, there’s nothing left to build a convincing control from. If it goes in the test group instead, the result depends almost entirely on what happens in one city. So in practice I usually take it out. That leaves even fewer regions to work with.
Some regions also behave like separate markets. Flanders and Wallonia, in Belgium, are the clearest case I’ve seen. They can feel like two different countries, so using one as the control for the other doesn’t really hold up. Sometimes it’s less obvious. In the Netherlands, the north and south behaved quite differently in my case, so I had to keep that in mind when grouping cities.
The tools are built for big markets too. I tried Recast’s geo-testing tool, but it was clearly designed around the US. So I built my own approach, using a method that works well across many regions. It didn’t take long to see that it struggled in small markets, which pushed me to look at other methods. I’ll come back to that in the next section.
On top of that, user-level testing is harder in Europe. It relies on following individual users, and privacy rules and cookie consent make that much more limited. In many countries, only a small share of users accept cookies. Geo-experiments only need aggregated data by region, so they’re often the practical option, even in markets where they’re hardest to run.
You can’t change the market. But you can change the design of the test.
What can you change when the design doesn’t work?
When the feasibility analysis says a test can’t work, there are still things you can change. I tend to go through them in roughly the same order, starting with the cheapest changes.
First, I check the data itself. Spikes and seasonality are usually the main problem, so before touching anything else, I make sure the weeks I’m working with are clean. If more history is available, I also use a longer period for the feasibility analysis. More past data gives a better picture of how noisy the market really is.
Then I look at duration. Up to around 12 weeks is usually still workable. Beyond that, a test gets much harder to keep clean, and as I explained earlier, each extra week buys you less and less.
Next comes the KPI, which has to match what the channel is supposed to do. I once ran a retention test for a paid social channel, and the team chose registrations as the KPI. I flagged the risk before launch, but they ran the test anyway. The results came back flat: the channel wasn’t driving incremental registrations. Well, of course it wasn’t! The campaign was built to bring users back, not to sign up new ones, so the test was looking in the wrong place from the start.
Moving to a higher-volume KPI can help, but only up to a point. The metric still has to mean something for the business. Registrations are a good option even if they aren’t sales. Sessions or installs come with plenty of volume, but few of them end up as a sale, so a change there doesn’t tell you much about revenue.
Moving to a higher-volume KPI can help, but only up to a point. The metric still has to mean something for the business.
Where the channel sits in the funnel matters too. Lower-funnel outcomes are usually easier to measure, because the channel is close to the conversion. Upper and mid-funnel channels are harder. YouTube is a good example. In one market, it accounted for less than 1% of registrations and first sales, far below what the test could detect. The first attempt, measured on registrations, came back completely flat. The test couldn’t detect an effect that small, so the result said nothing about whether YouTube worked. The only metric left was sessions, where YouTube’s share was around 6% against an MDE of 4%. That made the test possible, with exactly the trade-off I mentioned above. It told me about visits, not sales.
I rarely change the geographic unit at this stage because the clusters are usually already built. If you’re still working with regions, moving to cities or clusters gives you more units, as long as you watch out for spillovers between neighboring areas.
The method can also make a big difference. Many geo-experiments build the control as a weighted mix of regions, and the model has to learn the right weight for each one. That works well with dozens of regions, but with only a few noisy ones, the weights end up fitting the noise.
TBR, a method developed at Google, keeps it simpler. It adds all the test units into one series and all the control units into another, and then learns only how those two series relate. Adding units up also tames the noise. A city with one registration a week is almost pure noise, but fifty of them together give you something a test can work with.
I’ve also had better results with Bayesian tools like CausalImpact or CausalPy, for example in the Netherlands. They handle few units well and are honest about how uncertain the result is, though they can’t make a noisy market quiet. In very volatile markets, transforming the data can also help, but that gets more technical than I want to go here.
Spending more is another option, but it’s often less useful than people expect. A region only has so many people, and only so many of them are online. Push the budget too far and you saturate the market, to the point where the campaign can’t even spend all the money. That has happened to me more than once.
The other option is the holdout. In my experience, the local teams decide whether they want a lift or a holdout, and they usually prefer a lift. So I calculate the lift first, and if it can’t work, I offer the holdout. It creates the biggest effect you can get, but it costs sales and answers a different question.
If the gap is small, I can also adjust the statistical parameters. By default, a test checks whether sales went up or down (a two-sided test). If you only care whether they went up, you can switch to a one-sided test, which only looks in that direction. You can also lower the confidence level. Both reduce the MDE, but you will be less sure about the final result, so I use them only as a last adjustment if nothing else works.
In Austria, I needed to combine several of these at once to make the test possible.
Austria: redesigning a test to make it viable
Back to Austria. The plan was a lift test on Meta: increase spend in some regions and compare them with the rest. Austria has around nine million people and nine federal states, so the first design used the states as test and control units. It didn’t work. Each state had too little volume and too much week-to-week variation, and the MDE came out well above the effect the extra Meta spend could realistically produce.
Since this was my first test in Austria, there were no clusters yet, so the first change was the unit. Instead of states, I built 12 clusters of cities and left Vienna out, since it carried too much of the volume for the rest of the country to match. I also switched to TBR, which handles a small number of units much better than the methods designed for large markets. That brought the MDE down a lot, but it was still slightly above the expected effect. Meta drove only a small share of sales, so even a meaningful increase in spend wouldn’t move total sales much.
So I changed the KPI from sales to registrations, which have more volume and where Meta’s share was larger. That helped, but only a little. Next, I extended the test from six to ten weeks, still inside the range I consider workable. I moved to a one-sided test at 90% confidence, since the only question was whether more Meta spend increased registrations. And I used a longer history for the feasibility analysis, which gave a better estimate of how noisy the market really was.
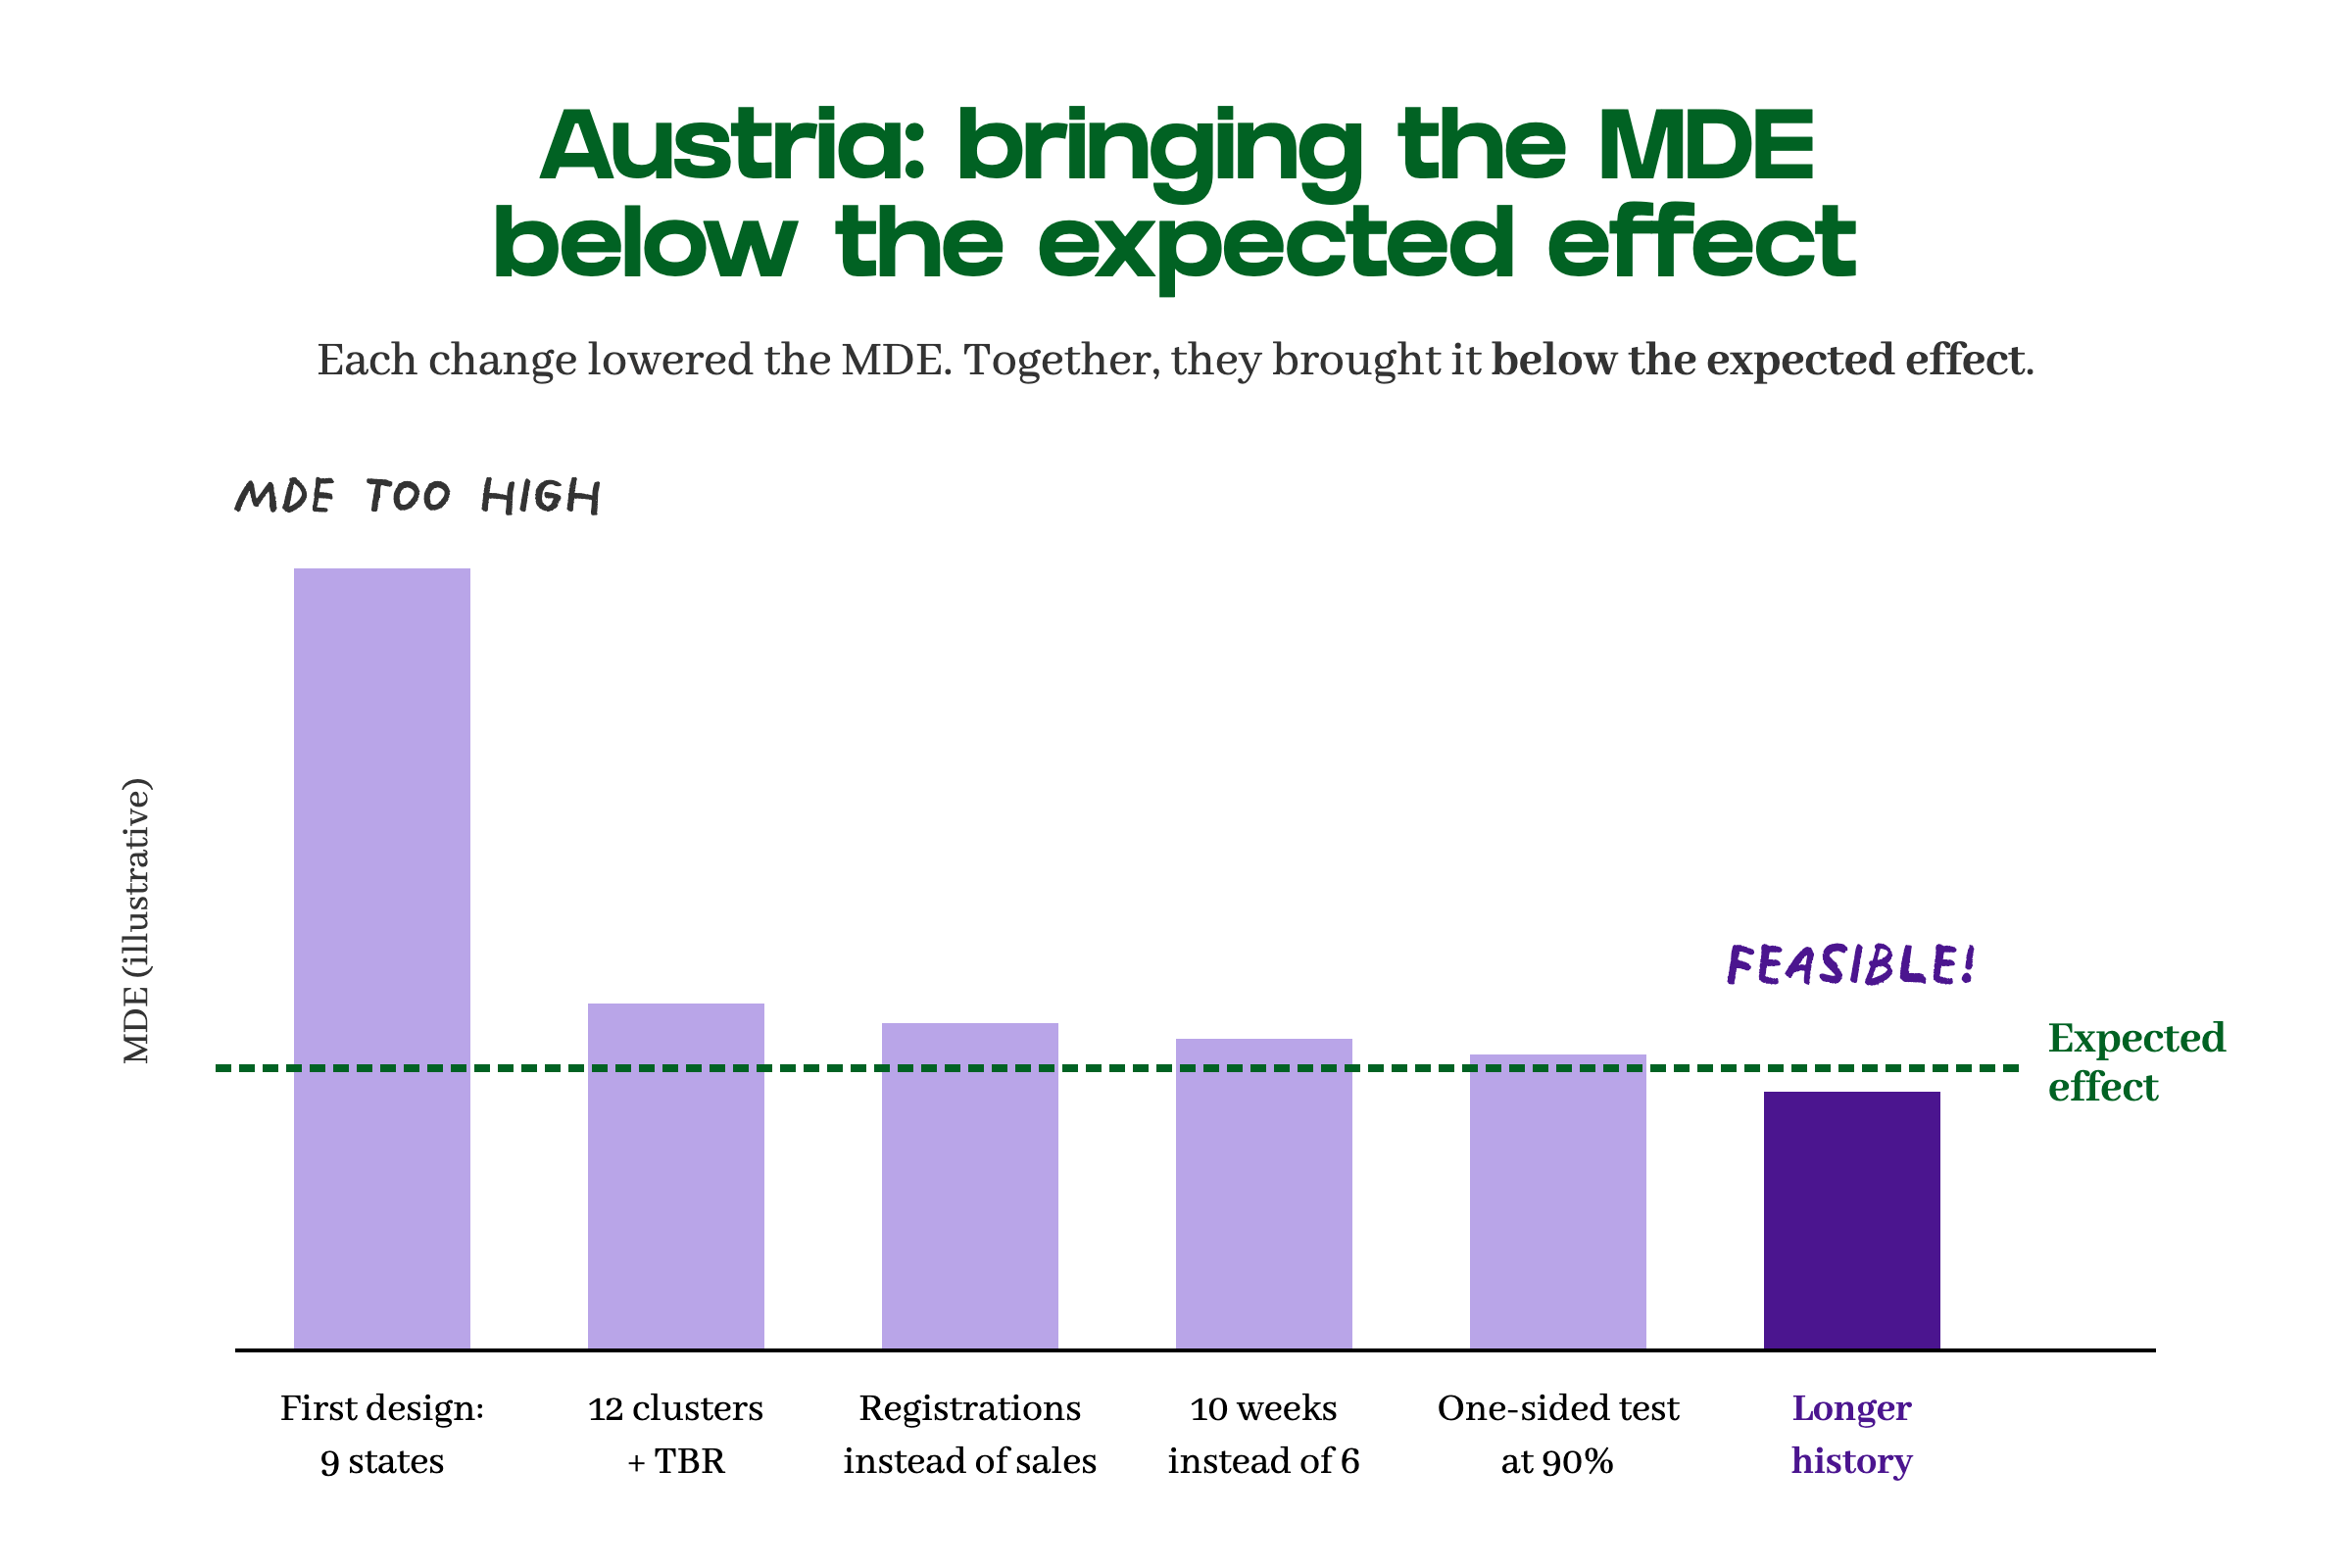
None of these changes solved the problem on its own. Together, they brought the MDE below the effect the extra spend was expected to produce, and the test became feasible. It ran for ten weeks, and the result was significant.
Each change came with a cost. Registrations aren’t sales, a 90% threshold leaves more room for a false positive, and ten weeks is a long time to keep a test clean. But the first design looked like a dead end, and in the end it took half a dozen changes to turn it into a test that could actually answer the question.
Before you launch
When a geo-experiment comes back flat, it’s tempting to conclude that the channel doesn’t work. Sometimes that’s true. But often, the test never saw the effect in the first place, and you can find that out before launch. Everything in this article comes down to a few points:
A test needs three things: groups that move together, no leaks between them, and an expected effect comfortably larger than the MDE.
Volume matters more than population. What counts is how many conversions each region or city brings in every week.
The calendar limits when you can test. Peaks and local events add noise and leave only a few clean windows a year.
Europe makes all of this harder. There are fewer regions, capitals that take most of the volume, and tools built for much bigger markets.
So before running one, I’d ask three questions:
What’s the smallest change this test could detect?
Is the effect you expect from the channel bigger than that?
And would a result of that size actually change what you do next?
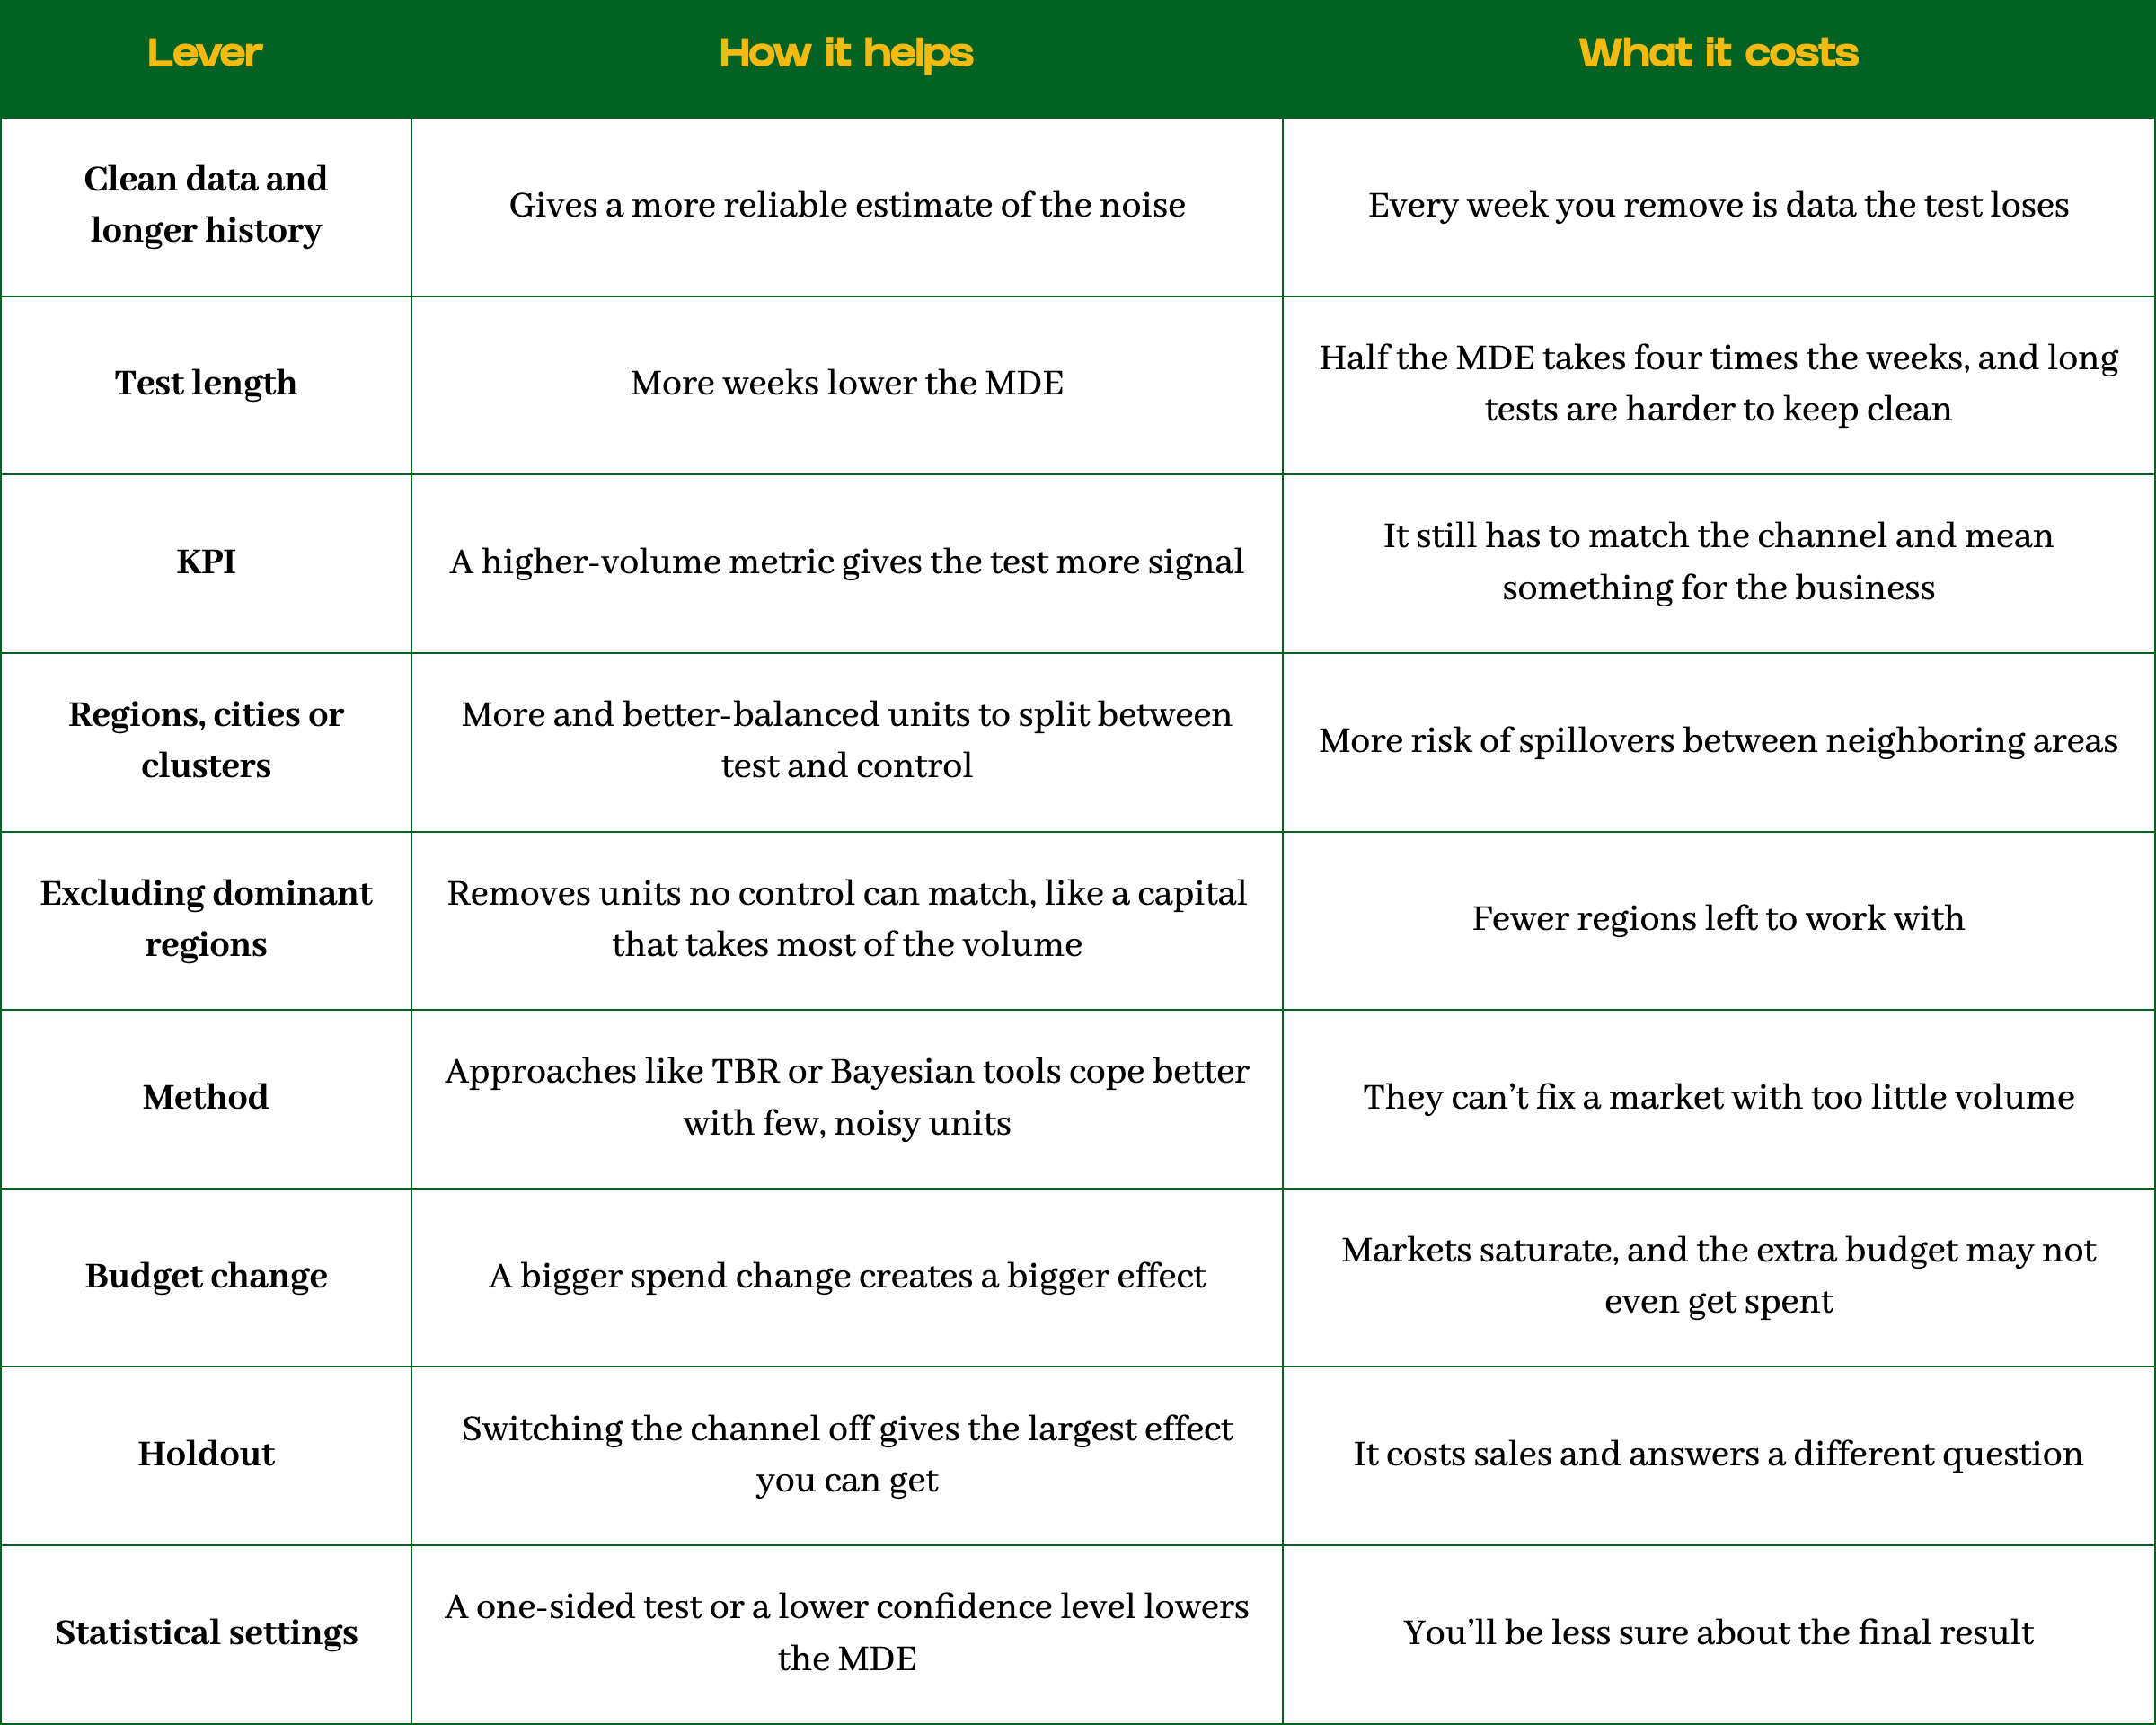
If the answer to either of the last two is no, the design needs to change first. These are the levers you can play with, and what each one costs:
No amount of careful analysis afterward will rescue a test that could never see the effect.